
ABSTRACT
Introduction and objectives: There is limited data on territorial longitudinal strain (TLS) as an echocardiographic marker in stable coronary artery disease (CAD). We evaluated the predictive role of TLS in stable CAD for identifying the location and severity of significant coronary artery stenosis.
Methods: We included patients presenting with chest pain, whereas those with myocardial infarction, arrhythmia, normal coronary angiography, previous percutaneous coronary intervention or coronary artery bypass grafting, and inadequate echocardiographic window were excluded. Among the 738 patients enrolled, a total of 199 study participants with stable CAD were selected and underwent speckle tracking echocardiography.
Results: Regional longitudinal strain (RLS) identified significant stenosis in at least 1 of the coronary arteries with sensitivity and specificity rates of 89.4% and 87.8%, respectively, and an area under curve (AUC) of 0.947 (P < .001). Receiver operating characteristic curve comparison demonstrated RLS had the highest predictive value for identifying significant stenosis with an optimal cutoff of ≥ -16% compared with regional radial strain (RRS) (AUC difference, 0.149; 95%CI, 0.132-0.167; P ≤ .0001), regional wall motion abnormality (RWMA) (AUC difference, 0.277; 95%CI, 0.262-0.293; P ≤ .0001), and regional circumferential strain (RCS) (AUC difference, 0.348; 95%CI, 0.327-0.368; P ≤ .0001).
TLS predicted significant proximal left anterior descending coronary artery stenosis when ≥ 4 of 7 territorial segments were impaired, significant proximal left circumflex artery stenosis when ≥ 3 of 5 territorial segments were impaired, and significant proximal right coronary artery stenosis when ≥ 3 of 5 territorial segments were impaired.
Conclusions: TLS predicted the location and severity of significant coronary artery stenosis in patients with stable CAD.
[Trial registration No. Md 110/2021].
Keywords: Coronary artery disease. Echocardiography. Ventricular dysfunction. Global longitudinal strain.
RESUMEN
Introducción y objetivos: Existen pocos datos sobre la deformación longitudinal territorial (DLT) como marcador ecocardiográfico en la enfermedad arterial coronaria (EAC) estable. El objetivo fue evaluar el valor predictivo de la DLT en la EAC estable para identificar la localización y el grado de estenosis coronaria significativa.
Métodos: Se incluyó a pacientes con dolor torácico y se excluyó a aquellos con infarto de miocardio, arritmia, angiografía coronaria normal, intervención coronaria percutánea o cirugía de revascularización aortocoronaria previas, o ventana ecocardiográfica deficiente. De los 738 pacientes incluidos se seleccionó a 199 con EAC estable, a los que se realizó una ecocardiografía con rastreo de marcas.
Resultados: La deformación longitudinal regional (DLR) identificó estenosis significativa en al menos 1 de las arterias coronarias, con una sensibilidad del 89,4%, una especificidad del 87,8% y un área bajo la curva (AUC) de 0,947 (p < 0,001). La comparación de las curvas ROC mostró que la DLR tenía el mejor valor predictivo para identificar estenosis significativa con un punto de corte ≥ –16% en comparación con la deformación radial regional (DRR) (la diferencia entre las AUC de la DLR y la DRR es 0,149; IC95%, 0,132-0,167; p ≤ 0,0001), la alteración de la contractilidad segmentaria (ACS) (la diferencia entre las AUC de la DLR y la ACS es de 0,277; IC95%, 0,262-0,293; p ≤ 0,0001) y la deformación circunferencial regional (la diferencia entre las AUC de la DLR y de la deformación circunferencial regional es de 0,348; IC95%, 0,327-0,368; p ≤ 0,0001). La DLT predijo una estenosis significativa de la arteria descendente anterior izquierda proximal si al menos 4 de los 7 segmentos territoriales estaban afectados, una estenosis significativa de la arteria circunfleja izquierda proximal si al menos 3 de los 5 segmentos territoriales estaban afectados, y una estenosis significativa de la arteria coronaria derecha proximal si al menos 3 de los 5 segmentos territoriales estaban afectados.
Conclusiones: La DLT predijo la ubicación y el grado de estenosis coronaria significativa en pacientes con EAC estable.
[Número de registro del estudio: Md 110/2021].
Palabras clave: Enfermedad arterial coronaria. Ecocardiografía. Disfunción ventricular. Deformación longitudinal global.
Abbreviations
CAD: coronary artery disease. GCS: global circumferential strain. GLS: global longitudinal strain. RLS: regional longitudinal strain. RRS: regional radial strain. RWMA: regional wall motion abnormality.
INTRODUCTION
Coronary artery disease (CAD) is a significant national and global public health concern. In 2021, more than 254 million cases of CAD were diagnosed worldwide, with an incidence rate of 403.89 new cases per 100,000 people and a mortality rate of 113.94 deaths per 100,000. In Egypt, CAD is the most prevalent cardiovascular disease among men and women, with an overall prevalence of 4.27%.1 Key risk factors for CAD include smoking, gender, diabetes, hypertension, and dyslipidemia, with men experiencing a 2-fold higher rate than women.2 Computed tomography is the standard diagnostic imaging modality for stable CAD, while high sensitivity C-reactive protein is recommended for predicting stable CAD. Although regional wall motion abnormality (RWMA) is the gold standard echocardiographic marker for stable CAD, it is not effective in detecting subclinical myocardial damage.3
Two-dimensional (2D) speckle tracking echocardiography (STE) strain analysis measures myocardial deformation providing a more reliable evaluation of myocardial mechanics and addressing the limitation of RWMA in identifying subtle myocardial damage.4 Real-world evidence suggests that global (GLS) and regional longitudinal strain (RLS) offer better diagnostic accuracy and reproducibility in detecting stable CAD.5-7 GLS assesses ventricular shortening from base to apex to estimate overall strain in the left ventricle (LV), whereas RLS focuses on strain in specific LV segments. Other strain analysis methods include global radial strain (GRS), global circumferential strain (GCS), territorial longitudinal strain (TLS), regional radial strain (RRS), and regional circumferential strain (RCS), each measuring different aspects of myocardial strain.8 Our study aimed to evaluate the predictive role of TLS in stable CAD for identifying significant coronary artery lesions with ≥ 70% diameter stenosis.
METHODS
Study design
We conducted a 24-month cross-sectional, open-label, single-cohort, single-center study was at the cath lab of a tertiary care teaching hospital. Investigators were not blinded to the study group. Prior to conducting the study, its design and protocol were reviewed, approved, and registered with Ain Shams University Hospital Human Ethics Committee on 1 July 2021 under trial registration No. Md 110/2021.
Written informed consents was obtained from all human research subjects and study participants. Participant privacy rights were strictly protected, data were anonymized, and study procedures were conducted in accordance with the Egyptian National Commission for Bioethics statement on ethical conduct in human research. Furthermore, the study adhered to the SAGER guidelines to address potential sex- and gender-related bias.
Study participants
Patients with typical or atypical anginal chest pain evaluated at the outpatient clinic and cath lab of a single tertiary care center between August 2021 and August 2023 were included in the study. Patients with acute coronary syndrome, myocardial infarction, non-sinus rhythm, normal coronary angiography (CAG), prior percutaneous coronary intervention or coronary artery bypass grafting, inadequate echocardiographic window, or valvular or myocardial disease were excluded.
Study procedures
A total of 738 patients were enrolled and undewent history taking and data collection for gender, age, diabetes mellitus, hypertension, smoking, dyslipidemia, chronic kidney disease, peripheral arterial disease, stroke, sedentary lifestyle, myocardial infarction, and family history of CAD. Furthermore, patients undewent blood pressure measurements and comprehensive cardiac examination, including assessment for abnormal auscultatory findings, prior cardiac surgery, cardiomegaly, and heart failure. Moreover, all patients underwent 12-lead electrocardiogram, 2D echocardiography and 2D STE using an IE 33 ultrasound system (Philips, The Netherlands) with an X5-1 phased-array transducer; CAG with digital image acquisition and storage, complete blood count; lipid profile; liver and kidney function tests; coagulation studies (prothrombin time, activated partial thromboplastin time, and international normalized ratio); and serial cardiac enzyme measurements. The 2D echocardiography was conducted before the CAG and the 2D STE after the CAG. The cardiologists performing 2D echocardiography and 2D STE were specialized in echocardiography, held level III competency according to the European Society of Cardiology Core Curriculum, and were blinded to the coronary angiographic data.9 Furthermore, the interventional cardiologists, who analyzed the CAGs were blinded to the results of the echocardiographic evaluation. Data documented with CAG included the severity of coronary artery stenosis according to the Coronary Artery Disease-Reporting and Data System and the regional distribution of the area supplied with the epicardial coronary artery according to the 17 LV segment model. A coronary lesion of ≥ 70% diameter stenosis was considered significant, and such patients were classified as having severe stable CAD.10 A consecutive sample of 199 eligible participants with severe stable CAD was selected, assigned, and allocated to a single group (figure 1). Operators performing 2D echocardiography and 2D STE were blinded to the coronary angiographic data. Data documented with 2D echocardiography and 2D STE included RWMA, wall motion score index (WMSI), and strain analysis. RWMA was categorized into normal with an assigned score of 1, hypokinetic with an assigned score of 2, akinetic with an assigned score of 3, and dyskinetic with an assigned score of 4. The WMSI represents the average RWMA of the 17 analyzed segments in a 17 LV segment model.11 Myocardial function by strain imaging was evaluated on a frame-by-frame basis by automatic tracking of acoustic markers (speckles) throughout the cardiac cycle in a 17 LV segment model, and GLS was obtained by averaging the myocardial function of all 17 segments. The endocardial borders were traced in the end-systolic frame of the 2D images from the 3 apical views for analyses of longitudinal strains. RCS analysis was obtained from the 3 parasternal short-axis views. RRS analysis from the 3 apical views was conducted manually by tracking the average peak systolic radial excursion for each segment between 2 points (endocardial and epicardial) of 3 levels for each of the 17 segments. Peak systolic strains were obtained for 17 longitudinal, 17 radial, and 16 circumferential LV segments. All segmental values were averaged to GLS and GCS for each study participant and automatically displayed in a bull’s-eye plot. TLS measured the number of impaired territories based on the cutoff results of the RLS analysis from the segments supplied with the corresponding coronary arteries in a 17 segment LV model as follows: 7 segments for the left anterior descending coronary artery (LAD), 5 for the right coronary artery (RCA), and 5 for the left circumflex artery (LCx).12
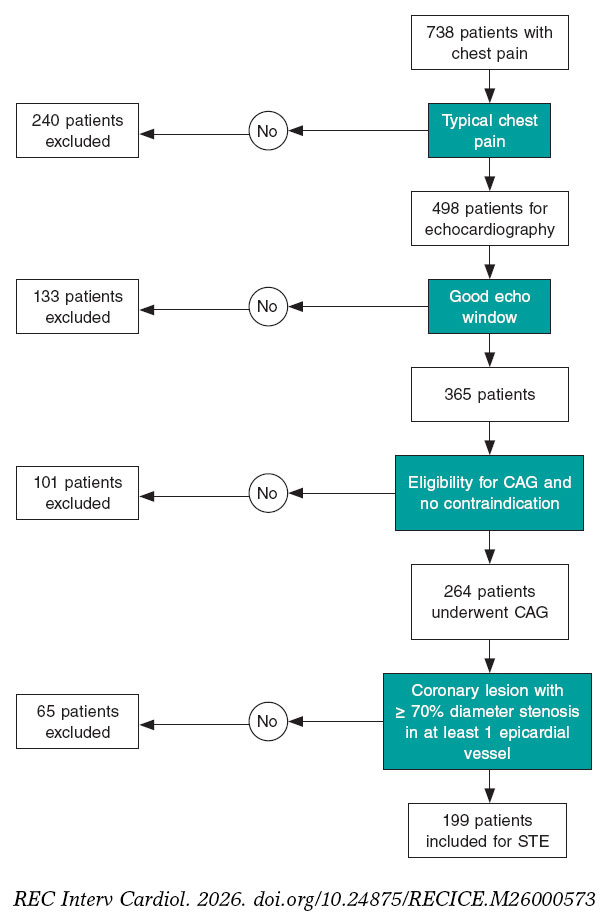
Figure 1. Flow chart of stable coronary artery disease cohort selection. CAG, coronary angiography; STE, speckle tracking echocardiography.
Endpoints
The endpoint of the study was the predictive role of TLS in stable CAD for identifying the location and severity of significant coronary artery lesion with ≥ 70% diameter stenosis.
Statistical analysis
Our study was a cross-sectional, open-label, single cohort, single center study. The echocardiographic assessment outcomes were coded, and data were analyzed with the SPSS v29 software package (IBM, United States). Shapiro-Wilks test was used to assess normality of data. Qualitative data was expressed as frequencies (number of cases) and relative frequencies (percentages), and quantitative data as means, standard deviations, medians, and interquartile ranges. Comparisons of parametrically distributed quantitative variables were performed using the Student t test or analysis of variance (ANOVA), whereas nonparametrically distributed quantitative variables were compared using the Mann-Whitney test, and between qualitative variables using the chi-square test or Fishers exact test, as appropriate.13,14 Inter- and intra-observer variability was assessed by reanalyzing the data of 18 randomly selected study participants and reported as intraclass correlation coefficient (ICC), whose scale ranges from 0 to 1 where 1 represents perfect reliability with no measurement error and 0, no reliability. An ICC value < 0.5 indicates poor reliability; 0.5-0.75, moderate reliability; 0.75-0.9, good reliability; and > 0.90, excellent reliability.15 The area under the curve (AUC) was constructed to detect the cutoff for optimal sensitivity and specificity of regional strains. Receiver operating characteristic (ROC) curve comparison was performed using MedCalc version 10.3.1.0 (MedCalc Software, United States). Confidence interval was set to 95% and the accepted margin of error at 5%. 01. A P value <05 was considered statistically significant, and a P value < .01 was considered highly significant. Final analyses were conducted according to the per-protocol approach.
RESULTS
Baseline characteristics and sociodemographic features
The baseline characteristics and sociodemographic features of the study cohort are shown in table 1. Male predominance was the pivotal sociodemographic characteristic of the enrolled participants (56.5%), and the mean age was 60.4 ± 9.9years. Baseline risk factors and comorbidities of the study cohort included hypertension in 68.5%, diabetes mellitus in 70%, dyslipidemia in 66%, and smoking in 47%, respectively. There were no withdrawals, and all participants completed the study.
Table 1. Baseline characteristics and sociodemographic features of stable coronary artery disease cohort
| Variable | Stable coronary artery disease cohort (No. = 199) | |
|---|---|---|
| Mean ± SD | Range | |
| Age, (years) | 60.4 ± 9.9 | 38 – 81 |
| Left ventricular ejection fraction | 53.9 ± 6.5 | 40 – 66 |
| Hypertension | 137 | 68.5 |
| Diabetes mellitus | 140 | 70 |
| Dyslipidemia | 132 | 66 |
| Current smoker | 94 | 47 |
| Gender | ||
| Male | 112 (56.6) | – |
| Female | 87 (43.5) | – |
|
Unless otherwise indicated, data are expressed as number (No.) and percentage (%) or mean ± standard deviation (SD). |
||
Coronary angiographic characteristics of stable coronary artery disease cohort
The location and severity of significant coronary lesions with ≥ 70% diameter stenosis is shown in table 2. Most study participants had single-vessel disease (68%). Among significant lesions, 63 (22%) were located in the LCx, 121 (43%) in the LAD, and 98 (35%) in the RCA.
Table 2. Coronary angiographic characteristics of stable coronary artery disease cohort
| Variable | Stable coronary artery disease cohort (No. = 199) | |||||
|---|---|---|---|---|---|---|
| Site of significant coronary lesions with ≥ 70% diameter stenosis (No., %) | Single-vessel disease | 2-vessel disease | 3-vessel disease | |||
| No. | % | No. | % | No. | % | |
| 135 | 68 | 45 | 23 | 19 | 10 | |
| Level of significant coronary lesions with ≥ 70% diameter stenosis (No., %) | LAD | LCX | RCA | |||
| No. | % | No. | % | No. | % | |
| Proximal | 74 | 61 | 40 | 63 | 51 | 52 |
| Mid | 42 | 35 | 0 | 0 | 16 | 16 |
| Distal | 5 | 4 | 23 | 37 | 31 | 32 |
| Total | 121 | 100 | 63 | 100 | 98 | 100 |
|
LAD, left anterior descending coronary artery; LCx, left circumflex artery; RCA, right coronary artery. |
||||||
Strain analysis of stable coronary artery disease cohort
The global strain analysis showed a GLS range of -26% to -8%, with a mean value of -16.4 ± 3.6%, and a GCS range of -35% to -10%, with a mean value of -18.4 ± 4.9%. The regional strain analysis (RSA) of 3383 segments showed RWMA in 3378 segments (99.8%), a mean WMSI of 1.3 ± 0.2 with sensitivity and specificity rates of 88% and 61%, respectively, GLS in 3365 segments (99.5%), GCS in 3184 segments (100%), global radial strain in 3352 segments (99%), significant hypoperfusion (coronary lesions with ≥ 70% diameter stenosis) in 1472 segments (43%), and normal perfusion to mild-to-moderate hypoperfusion (coronary lesions with < 70% diameter stenosis) in 1911 segments (57%). The medians and the interquartile ranges of the regional strain parameters for coronary lesions with ≥ 70% diameter stenosis demonstrated significant differences vs the corresponding parameters for coronary lesions with < 70% diameter stenosis. The median RLS was -20% (IQR, -23% to -17%) for lesions < 70% diameter stenosis vs -12% (IQR, -14% to -9%) for lesions ≥ 70% diameter stenosis (P < .001). The median RRS was 40% (IQR, 38%-43%) for lesions < 70% diameter stenosis vs 33% (IQR, 21%-39%) for lesions ≥ 70% diameter stenosis (P < .001) (figure 2). The median RCS was -19% (IQR, -24% to -14%) for lesions < 70% diameter stenosis vs -17% (IQR, -22% to -12%) for lesions ≥ 70% diameter stenosis (P < .001). RWMA were detected in 38% of the segments supplied by significant coronary lesions with ≥ 70% diameter stenosis compared with 6% of the segments supplied by non-significant coronary lesions with < 70% diameter stenosis (P < .001).
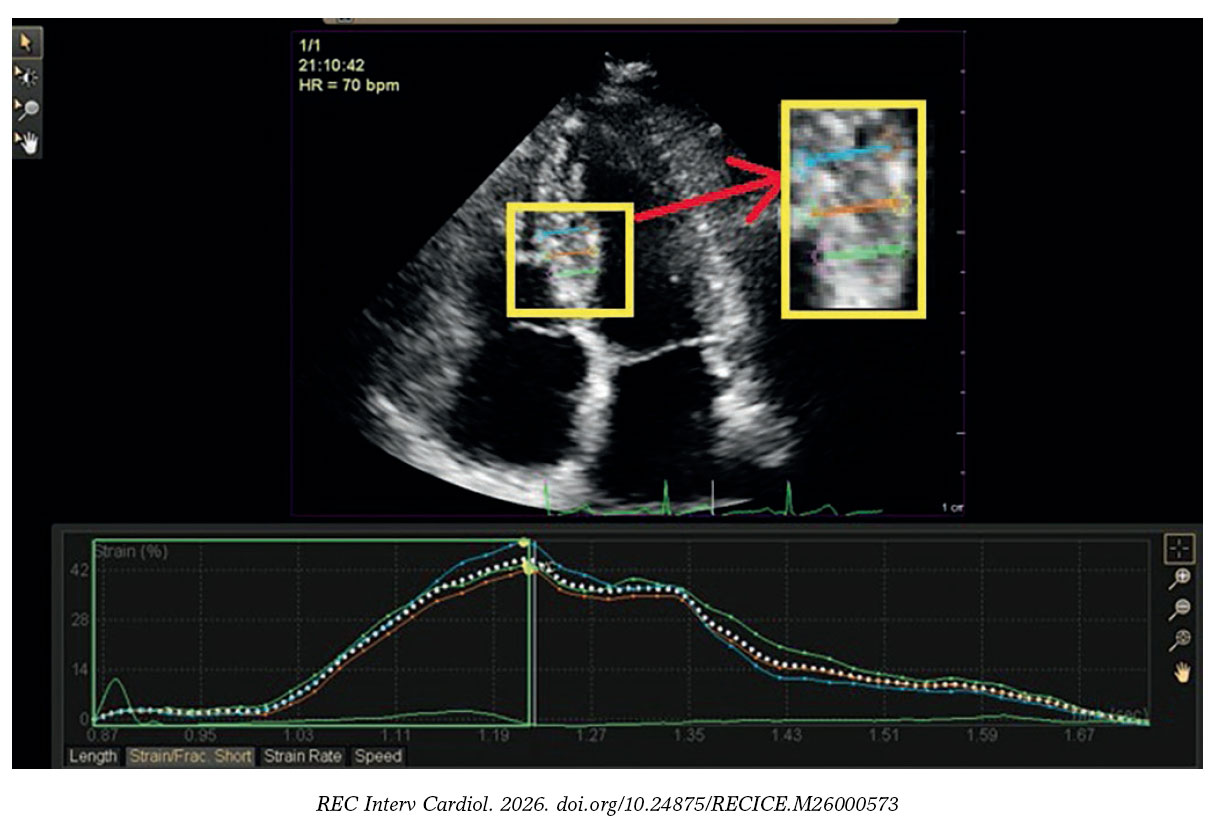
Figure 2. Regional radial strain analysis of a study participant with stable coronary artery disease showing 42% strain of the mid inferoseptal segment.
Feasibility and reproducibility of stable coronary artery disease cohort
The ICC for inter- and intra-observer variability of segmental strains were measured in 21 of the 199 patients study cohort (11%). The results of the ICC for inter- and intra-observer variability of segmental strains were 0.91 and 0.96 for GLS, 0.94 and 0.97 for GCS, and 0.86 and 0.92 for GRS.
ROC curve and area under the curve analysis in patients with stable coronary artery disease
AUC was constructed to detect the cutoff for optimal sensitivity and specificity of regional strains (table 3). The AUC for RLS was 0.947 (P < .001) which detected a cutoff of ≥ -16% for optimal sensitivity and specificity of RLS. ROC curve comparison showed that RLS exhibited the highest predictive value for identifying significantly hypoperfused segments (with ≥ 70% diameter stenosis) at a cutoff of ≥ -16% vs the RRS (AUC difference, 0.149; 95%CI, 0.132-0.167; P ≤ .0001), RWMA (AUC difference, 0.277; 95%CI, 0.262-0.293; P ≤ .0001), and RCS (AUC differ- ence, 0.348; 95%CI, 0.327-0.368; P ≤ .0001), respectively (figure 3).
Table 3. Area under curve for detection of cutoff for optimal sensitivity and specificity of the regional strains
| Variable | Cutoff | AUC | 95%CI | Sensitivity (%) | Specificity (%) | P-value |
|---|---|---|---|---|---|---|
| RLS | ≥ -16 | 0.947 | 0.938-0.953 | 89.4 | 87.8 | < .001* |
| RCS | ≥ -19 | 0.599 | 0.582-0.617 | 60.7 | 54.4 | < .001* |
| RRS | ≤ 35 | 0.8 | 0.786-0.813 | 57.8 | 92.3 | < .001* |
|
Data is presented as percentages. 95%CI, 95% confidence interval; AUC, area under the curve; RCS, regional circumferential strain; RLS, regional longitudinal strain; RRS, regional radial strain. * Statistically significant P value. |
||||||
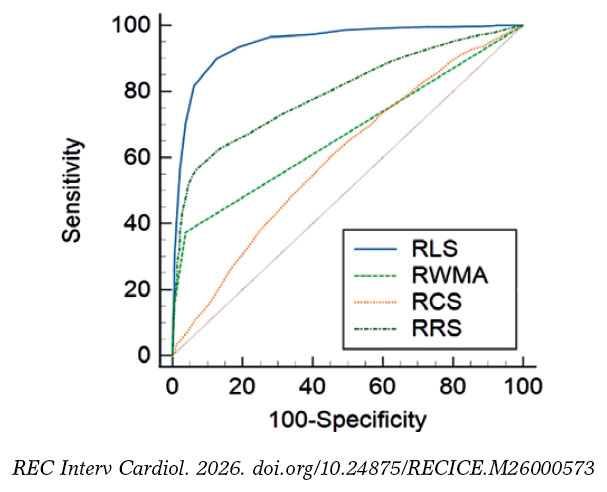
Figure 3. Receiving operating characteristic curve comparison of stable coronary artery disease cohort comparing regional longitudinal strain, regional radial strain, regional circumferential strain, and regional wall motion abnormalities in predicting significant ≥ 70% diameter stenosis. RCS, regional circumferential strain; RLS, regional longitudinal strain; RRS, regional radial strain; RWMA, regional wall motion abnormality.
ROC curve analysis of regional longitudinal strain in patients with stable coronary artery disease
Guided by the detected cutoff of ≥ -16% for the optimal sensitivity and specificity of RLS, the predictive role of TLS in stable CAD for identifying the location and severity of significant coronary artery lesions with ≥ 70% diameter stenosis was explored (table 4). The ROC curve analysis of the RLS at a cutoff of ≥ -16% demonstrated that the optimal number of impaired segments that could predict the location and severity of significant coronary lesions with ≥ 70% diameter stenosis was ≥ 3 impaired segments out of the 7 territorial segments of LAD to predict proximal or significant lesion in the mid-LAD and ≥ 3 impaired segments among the 5 territorial segments of either the LCx or RCA to predict proximal significant lesion in the LCx or RCA (figure 4).
Table 4. Receiving operating characteristic curve analysis of regional longitudinal strain
| Vessel | Level | No. | AUC | Sensitivity (%) | Specificity (%) | 95%CI | P-value |
|---|---|---|---|---|---|---|---|
| LAD (7 segments) | Proximal | ≥ 4 | 0.952 | 93.20 | 83.30 | 0.913-0.977 | < .001* |
| Mid | ≥ 3 | 0.911 | 92.20 | 73.80 | 0.862-0.946 | < .001* | |
| Distal | ≥ 2 | 0.902 | 95.80 | 68.30 | 0.852-0.939 | < .001* | |
| LCx (5 segments) | Proximal | ≥ 3 | 0.897 | 87.50 | 85 | 0.846-0.935 | < .001* |
| Distal | ≥ 2 | 0.87 | 92 | 70.80 | 0.815-0.913 | < .001* | |
| RCA (5 segments) | Proximal | ≥ 3 | 0.928 | 88.20 | 83.90 | 0.883-0.960 | < .001* |
| Mid | ≥ 3 | 0.942 | 88 | 92.50 | 0.9-0.970 | < .001* | |
| Distal | ≥ 2 | 0.932 | 91.80 | 80.40 | 0.888-0.963 | < .001* | |
|
Receiving operating characteristic curve analysis of regional longitudinal strain in stable coronary artery disease to explore the role of territorial longitudinal strain in predicting the site and level of significant ≥ 70% diameter stenosis. 95%CI, 95% confidence interval; AUC, area under the curve; LAD, left anterior descending coronary artery; LCx, left circumflex artery; RCA, right coronary artery. * Statistically significant P value. |
|||||||
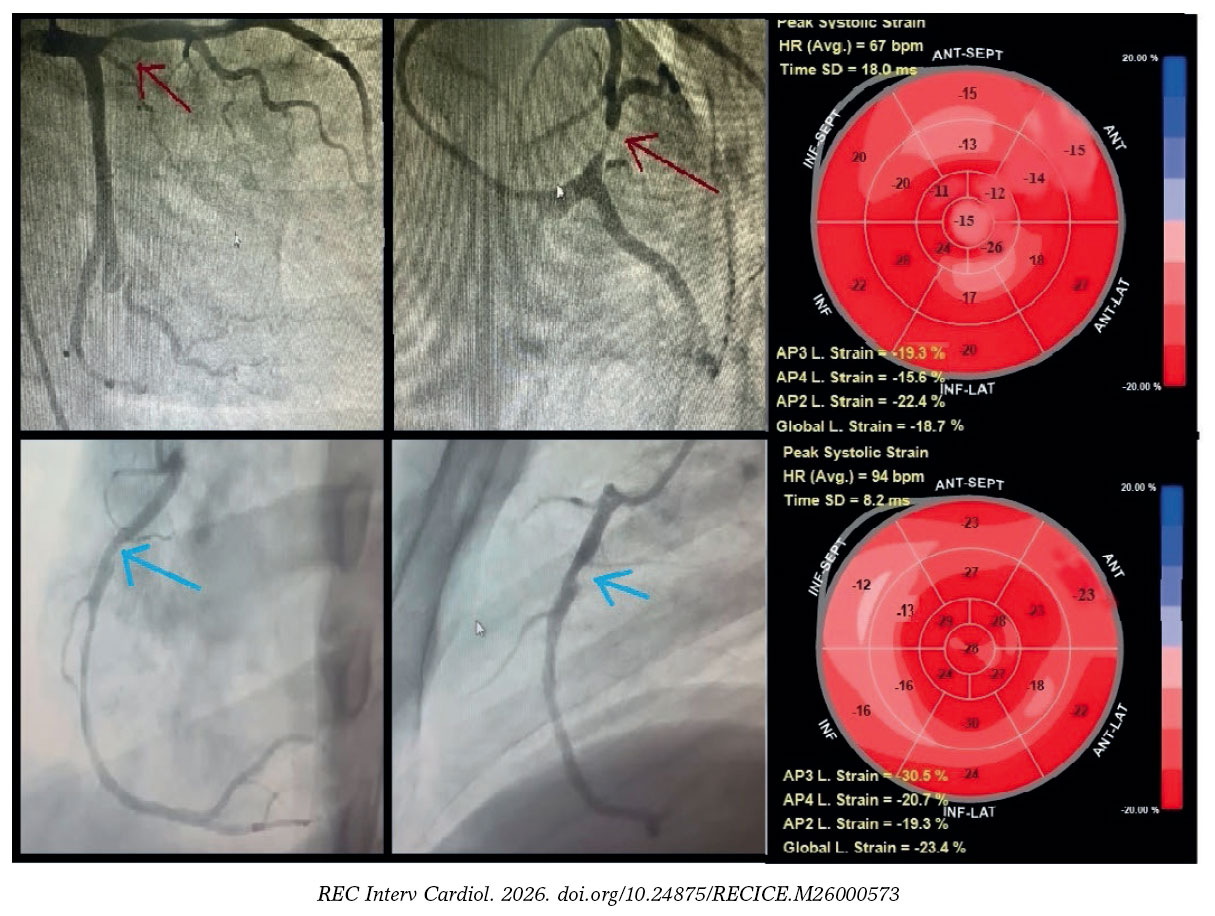
Figure 4. Territorial longitudinal strain of study participants with stable coronary artery disease. Top row: representative study participant with significant proximal left anterior descending coronary artery lesion (≥ 70% diameter stenosis; red arrow). Global longitudinal (L) strain was -18.7%. Seven segments within the left anterior descending coronary artery territory (anteroseptal, anterior regions, and apex) demonstrated impaired strain (≥ -16%), consistent with a true-positive finding, whereas left circumflex and right coronary artery territories showed preserved strain (< -16%), consistent with true-negative findings. Bottom row: representative of a study participant with a significant proximal right coronary artery lesion (≥ 70% diameter stenosis; blue arrow). Global longitudinal strain was -23.3%. Four segments within the right coronary artery territory (mid, basal inferior, and inferoseptal) demonstrated impaired strain (≥ -16%), consistent with a true-positive finding, whereas left anterior descending artery and left circumflex artery territories showed preserved strain (< -16%), consistent with true-negative findings.
DISCUSSION
Despite being the gold standard echocardiographic marker for stable CAD, RWMA is ineffective at detecting subclinical myocardial damage.3 Our study aimed to evaluate the predictive capability of TLS in identifying the location and severity of significant coronary lesions with ≥ 70% diameter stenosis.
Participants in our study had a mean age of 60.4 ± 9.9 years (range, 38-81 years), with 112 men (56.5%). Most participants had single-vessel disease (68%); 45 (23%), 2-vessel disease; and 19 (10%), 3-vessel disease. Significant coronary lesions with ≥ 70% diameter stenosis were located in the LCx, LAD, and RCA in 63 (22%), 121 (43%), and 98 cases (35%), respectively. Similarly, Koulaouzidis et al. found that 57% of their participants had single-vessel disease with ≥ 50% diameter stenosis.16 Observational studies suggest that most single-vessel coronary occlusions occur in the proximal LAD.17,18
In our cross-sectional study, GLS ranged from -26% to -8%, averaging -16.4 ± 3.6%, while RLS for lesions < 70% diameter stenosis was -20% (IQR, -23% to -17%) vs -12% (IQR, -14% to -9%) for lesions ≥ 70% diameter stenosis (P < .001). Norum et al. concluded that a GLS cutoff of -17.4% to -20.3% could predict CAD in patients with chest pain, with sensitivity rates between 51% and 81% and specificity rates between 58% and 81%.19 There is limited real-world data on RSA in stable CAD. Montgomery et al. found that summed LAD segmental strain demonstrated a sensitivity and specificity of 66% at a cutoff of -20.3% for predicting LAD lesions ≥ 50% diameter stenosis.20 Shimoni et al. demonstrated that segmental analysis using the least 10-percentile peak systolic strain (PSS) outperformed global PSS and GLS.21 Biering-Sørensen et al. observed that significant left main stenosis (≥ 70%) affected apical longitudinal strain (ALS) more than significant lesions did in the LAD or LCx, despite similar GLS results.22 Carstensen et al. studied asymptomatic CAD in patients with aortic stenosis using an 18-segment LV model, finding that only ALS and mid-longitudinal strain were significant independent predictors of asymptomatic CAD, which is consistent with other studies indicating that proximal lesions impact all defined regions.23-25 Liu et al. showed that a cutoff of ≥ -23.5% for endocardial RLS and GLS of the LAD was higher in identifying significant LAD stenosis (≥ 50%) vs strain values from other layers.26
Our findings indicate that at a cutoff of ≥ -16%, TLS can predict the location and severity of significant coronary lesions with ≥ 70% diameter stenosis. Specifically, impairment of ≥ 3 of 7 in the LAD predicted significant proximal or mid lesions, whereas impairment of ≥ 3 of 5 segments in either the LCx or RCA predicted significant proximal lesions. TLS has not been extensively studied in stable CAD. Eek et al. found that at a cutoff of ≥ -14%, impaired blood supply in ≥ 4 segments predicted acute coronary occlusion with improved sensitivity (85%) and specificity (70%) vs the left ventricular ejection fraction.12 Sarvari et al. noted that although TLS, GLS, and GCS were affected in patients with non-ST-segment elevation myocardial infarction, the differences between GLS and TLS were not statistically significant.24 Caspar et al. demonstrated that TLS has high predictive value for significant lesions with ≥ 50% diameter stenosis across the 3 major coronary territories.25
The takeaway from our study is that TLS enhances the diagnostic capacity of RLS, accurately predicting both the location and severity of significant coronary lesions with ≥ 70% diameter stenosis. While several non-invasive methods show acceptable sensitivity and specificity,27 they usually face limitations regarding availability and cost. Echocardiography is widely accessible, and strain analysis can be performed offline, making it beneficial for patients with chest pain, allowing for assessment prior to invasive procedures or costly imaging modalities. Further studies are needed to clarify the diagnostic and prognostic significance of TLS in patients with chest pain.
Strengths and limitations
Our study was conducted on a well-balanced cohort with regards to the risk factors and baseline characteristics and did not have missing data allowing robust per protocol analysis, the interventional cardiologists who analyzed the CAGs were blinded to the results of the echocardiographic evaluation, whereas the investigators who performed the 2D echocardiography and the 2D STE were blinded to the coronary angiographic data, hence observer bias was minimized. Despite its strengths, the limitations of the study require consideration. It was a single centre cross-sectional study which didn’t allow us to investigate the chronological relationship between the echocardiographic and the coronary angiographic data in stable patients with CAD. There was no invasive functional assessment of the coronary blood flow with fractional flow reserve, RRS was assessed manually, and 36 study participants (18%) with impaired myocardial function (left ventricular ejection fraction ≤ 50%) were selected for the study. Patients with stable CAD patients and coronary microvascular disease (microvascular angina) and normal CAG and patients with stable CAD and abnormal CAG with coronary lesions with < 70% diameter stenosis were excluded from the study cohort overestimating the RLS of the study cohort. Inclusion of patints with stable CAD and abnormal CAG with coronary lesions with ≥ 70% diameter stenosis could only limit the generalizability of the study results to the population with stable CAD. Ultimately, ROC curve analysis of RLS in stable CAD, used to explore the role of TLS in predicting the location and severity of significant ≥ 70% diameter stenosis relied on clinically limited metrics, namely sensitivity and specificity. As a result, the high RLS performance estimate (0.947) may be biased, and the cutoff of ≥ -16% potentially misleading. Consequently, WMSI was not included in the analyss, and no incremental diagnostic value for RLS over WMSI could be established.
CONCLUSIONS
RLS indicated potential clinical relevance in the diagnosis of stable CAD and TLS demonstrated a significant ability to predict the site and level of significant coronary lesion with ≥ 70% diameter stenosis in patients with stable CAD.
DATA AVAILABILITY
Data are available from the corresponding author upon request.
FUNDING
None declared.
ETHICAL CONSIDERATIONS
The study design and protocol were approved by the human ethics committee of the Ain Shams University Hospital before study initiation on 1 July, 2021. The study was registered and assigned trial registration No. Md 110 / 2021. Written informed consent was obtained from all human research subjects and study participants, including consent for publication. Participant privacy was strictly protected, and all data were anonymized, informed consents were signed by study participants for publication, and the study procedures were conducted in full compliance with the Egyptian National Commission for Bioethics statement on ethical conduct in human research, and SAGER guidelines have been followed with respect to possible sex/gender bias.
STATEMENT ON THE USE OF ARTIFICIAL INTELLIGENCE
The authors declare that they have not used any type of generative artificial intelligence for the drafting of this manuscript, nor for the creation of images, graphics, tables, or their corresponding captions.
AUTHORS’ CONTRIBUTIONS
The study was designed by A. Rezq and H. Shaalan, the data was collected, analyzed, and interpreted by M.A. Hashem and A.E. Nayel, the manuscript was drafted by M.A. Hashem and critically reviewed by A. Rezq, A.K. Araquib, A.E. Nayel, and H. Shaalan, and A. Rezq, A.E. Nayel, A.K. Araquib, and H. Shaalan approved the final manuscript. The authors take full responsibility for all aspects of the reliability and freedom from bias of the data presented and their discussed interpretation.
CONFLICTS OF INTEREST
None declared.
WHAT IS KNOWN ABOUT THE TOPIC?
- CAD is the most prevalent cardiovascular condition among Egyptian men and women, with an overall prevalence of 4.27%. Computed tomography is the standard diagnostic imaging modality for stable CAD, while high sensitivity C-reactive protein is the recommended test for predicting stable CAD.
- Although RWMA is the gold standard echocardiographic marker for stable CAD, it is not effective in detecting subclinical myocardial damage.
- Real-world evidence shows that myocardial strain analysis methods with 2D STE, including RLS, GLS, GCS, TLS, and RRS, offer better diagnostic accuracy and reproducibility in detecting stable CAD, provide a more reliable evaluation of myocardial mechanics in stable CAD, and address the limitation of RWMA in identifying subtle myocardial damage.
WHAT DOES THIS STUDY ADD?
- Our study showed that, at a cutoff of ≥ -16%, RLS is the optimal imaging biomarker for predicting significant ≥ 70% diameter stenosis in stable CAD.
- Our study showed that TLS is a promising imaging biomarker for predicting the site and level of significant ≥ 70% diameter stenosis in stable CAD.
REFERENCES
1. GBD Results. Institute for Health Metrics and Evaluation. 2025. Available at:https://vizhub.healthdata.org/gbd-results. Consulted 15 May 2025.
2. Gao Z, Chen Z, Sun A, Deng X. Gender differences in cardiovascular disease. Med Nov Technol Devices. 2019;4:100025.
3. Bansal M, Kasliwal RR. How do I do it?Speckle-tracking echocardiography. Indian Heart J. 2013;65:117-123.
4. Muraru D, Niero A, Rodriguez-Zanella H, Cherata D, Badano L. Three-dimensional speckle-tracking echocardiography:benefits and limitations of integrating myocardial mechanics with three-dimensional imaging. Cardiovasc Diagn Ther. 2018;8:101-117.
5. Reant P, Labrousse L, Lafitte S, et al. Experimental validation of circumferential, longitudinal, and radial 2-dimensional strain during dobutamine stress echocardiography in ischemic conditions. J Am Coll Cardiol. 2008; 51:149-157.
6. Bajracharya P, Acharya KP, Banerjee SK, et al. Correlation between Myocardial Strain by 2-D Speckle-Tracking Echocardiography and Angiographic findings by Coronary Angiogram in Stable Angina. Maedica (Bucur). 2020; 15:365-372.
7. Norum IB, Otterstad JE, Ruddox V, Bendz B, Edvardsen T. Novel regional longitudinal strain by speckle tracking to detect significant coronary artery disease in patients admitted to the emergency department for chest pain suggestive of acute coronary syndrome. J Echocardiogr. 2022;20:166-177.
8. Cerqueira MD, Weissman NJ, Dilsizian V, et al. Standardized myocardial segmentation and nomenclature for tomographic imaging of the heart. A statement for healthcare professionals from the Cardiac Imaging Committee of the Council on Clinical Cardiology of the American Heart Association. Circulation. 2002;105:539-542.
9. Popescu BA, Andrade MJ, Badano LP, et al. European Association of Echocardiography recommendations for training, competence, and quality improvement in echocardiography. Eur J Echocardiogr. 2009;10:893-905.
10. Knipe H, Martínez Juárez D, Silverstone L, et al. Coronary artery disease. Radiology Reference Article. Radiopaedia. 2026. https://doi.org/10.53347/rID-43406
11. Steeds RP, Wheeler R, Bhattacharyya S, et al. Stress echocardiography in coronary artery disease:a practical guideline from the British Society of Echocardiography. Echo Res Pract. 2019;6:G17-G33.
12. Eek C, Grenne B, Brunvand H, et al. Strain echocardiography predicts acute coronary occlusion in patients with non-ST-segment elevation acute coronary syndrome. Eur J Echocardiogr. 2010;11:501-508.
13. Chan YH. Biostatistics 102:quantitative data - Parametric &non-parametric Tests. Singap Med J. 2003;44:391–396.
14. Chan YH. Biostatistics 103:qualitative data –tests of Independence. Singap Med J. 2003;44:498–503
15. Koo TK, Li MY. A Guideline of Selecting and Reporting Intraclass Correlation Coefficients for Reliability Research. J Chiropr Med. 2016;15:155-163.
16. Koulaouzidis G, Kleitsioti P, Kalaitzoglou M, et al. Left Ventricular Longitudinal Strain Detects Ischemic Dysfunction at Rest, Reflecting Significant Coronary Artery Disease. Diagnostics (Basel). 2025;15:1102.
17. Ahmed IAM, Khalid NHM, Abd-Elmagid AEM, Abdullah MAM, Musa AMI, Al-Qarni NO. Common coronary artery occlusions in patients with myocardial infarction. Pan Afr Med J. 2022;42:254.
18. Wang TY, Zhang M, Fu Y, et al. Incidence, distribution, and prognostic impact of occluded culprit arteries among patients with non-ST-elevation acute coronary syndromes undergoing diagnostic angiography. Am Heart J. 2009;157:716-723.
19. Norum IB, Ruddox V, Edvardsen T, Otterstad JE. Diagnostic accuracy of left ventricular longitudinal function by speckle tracking echocardiography to predict significant coronary artery stenosis. A systematic review. BMC Med Imaging. 2015;15:25.
20. Montgomery DE, Puthumana JJ, Fox JM, Ogunyankin KO. Global longitudinal strain aids the detection of non-obstructive coronary artery disease in the resting echocardiogram. Eur Heart J Cardiovasc Imaging. 2012; 13:579-587.
21. Shimoni S, Gendelman G, Ayzenberg O, et al. Differential effects of coronary artery stenosis on myocardial function:the value of myocardial strain analysis for the detection of coronary artery disease. J Am Soc Echocardiogr. 2011;24:748-757.
22. Biering-Sørensen T, Hoffmann S, Mogelvang R, et al. Myocardial strain analysis by 2-dimensional speckle tracking echocardiography improves diagnostics of coronary artery stenosis in stable angina pectoris. Circ Cardiovasc Imaging. 2014;7:58-65.
23. Carstensen HG, Larsen LH, Hassager C, Kofoed KF, Jensen JS, Mogelvang R. Association of ischemic heart disease to global and regional longitudinal strain in asymptomatic aortic stenosis. Int J Cardiovasc Imaging. 2015; 31:485-495.
24. Sarvari SI, Haugaa KH, Zahid W, et al. Layer-specific quantification of myocardial deformation by strain echocardiography may reveal significant CAD in patients with non-ST-segment elevation acute coronary syndrome. JACC Cardiovasc Imaging. 2013;6:535-544.
25. Caspar T, Samet H, Ohana M, et al. Longitudinal 2D strain can help diagnose coronary artery disease in patients with suspected non-ST-elevation acute coronary syndrome but apparent normal global and segmental systolic function. Int J Cardiol. 2017;236:91-94.
26. Liu C, Li J, Ren M, et al. Multilayer longitudinal strain at rest may help to predict significant stenosis of the left anterior descending coronary artery in patients with suspected non-ST-elevation acute coronary syndrome. Int J Cardiovasc Imaging. 2016;32:1675-1685.
27. Danad I, Szymonifka J, Twisk JWR, et al. Diagnostic performance of cardiac imaging methods to diagnose ischaemia-causing coronary artery disease when directly compared with fractional flow reserve as a reference standard:a meta-analysis. Eur Heart J. 2017;38:991-998.


