
ABSTRACT
Introduction and objectives: Several prior studies have demonstrated an inverse volume-outcome relationship for various cardiac procedures. Whether this association exists in patients undergoing mitral transcatheter edge-to-edge repair (M-TEER) remains unknown.
Methods: National Readmission Database 2014–2019 was used to categorize hospitals according to annual TEER procedural volume. Hospitals were grouped into low-, medium-, and high-volume centers. Rates of in-hospital events, 30-day mortality, and 30-day readmission were examined using regression models adjusted for baseline characteristics and comorbidities.
Results: Of the 33 980 patients who underwent M-TEER between 2014 and 2019, 1054 (3.1%), 11 734 (34.5%), and 21 192 (62.4%) were treated at low-, medium-, and high-volume hospitals, respectively. Compared with high-volume hospitals, low-volume hospitals had higher adjusted odds of 30-day inpatient mortality (aOR, 1.65; 95%CI, 1.05–2.61; P = .03) and 30-day readmission (aOR, 1.27; 95%CI, 1.00–1.61; P = .048), and a longer length of stay (8.6 ± 13.4 vs 5.0 ± 9.6 days; P < .01).
Conclusion: The number of centers performing M-TEER increased exponentially during the study period, with procedural adoption extending across hospitals with different procedural volumes. However, an inverse relationship was observed between procedural volume and 30-day outcomes, with higher mortality and readmission rates at low-volume hospitals than at high-volume centers. Further research focusing on establishing standardized protocols may help reduce these disparities.
Keywords: M-TEER volume; hospital volume-outcome relationship; 30-day mortality; readmission rates; National Readmission Database.
RESUMEN
Introducción y objetivos: Numerosos estudios han demostrado una relación inversa entre el volumen y los resultados clínicos en diversos procedimientos cardiacos. Se desconoce si dicha asociación existe en pacientes sometidos a reparación mitral percutánea de borde a borde (TEER).
Métodos: Se utilizó la National Readmission Database 2014–2019 para categorizar a los hospitales según el volumen anual de procedimientos de TEER, y se agruparon en centros de bajo, medio y alto volumen. Se analizaron las tasas de episodios intrahospitalarios, la mortalidad a 30 días y la readmisión a 30 días mediante modelos de regresión ajustados por las características basales y la comorbilidad.
Resultados: De los 33.980 pacientes que se sometieron a TEER entre 2014 y 2019, 1.054 (3,1%), 11.734 (34,5%) y 21.192 (62,4%) fueron tratados en hospitales de bajo, medio y alto volumen, respectivamente. En comparación con los hospitales de alto volumen, los de bajo volumen presentaron una mayor probabilidad ajustada (ORa) de mortalidad hospitalaria a 30 días (ORa = 1,65; IC95%, 1,05–2,61; p = 0,03) y de readmisión a 30 días (ORa = 1,27; IC95%, 1,00–1,61; p = 0,048), así como una estancia hospitalaria más prolongada (8,6 ± 13,4 frente a 5,0 ± 9,6 días; p < 0,01).
Conclusiones: El número de centros que realizan TEER ha crecido exponencialmente durante el periodo de estudio, y la adopción del procedimiento se ha extendido en hospitales de diferentes volúmenes. Sin embargo, se observa una relación inversa entre el volumen de procedimientos y los resultados a 30 días, con tasas de mortalidad y de readmisión más elevadas en los hospitales de bajo volumen en comparación con los centros de alto volumen. Investigaciones adicionales centradas en el establecimiento de protocolos podrían ayudar a reducir estas disparidades.
Palabras clave: Volumen de TEER mitral. Relación volumen-resultado hospitalario. Mortalidad a 30 días. Tasas de readmisión. National Readmission Database.
Abbreviations
COPD: chronic obstructive pulmonary disease. MR: mitral regurgitation. M-TEER: mitral transcatheter edge-to-edge repair. NRD: National Readmission Database. PCI: percutaneous coronary intervention. SMVR: surgical mitral valve replacement.
INTRODUCTION
Mitral regurgitation (MR) is one of the most prevalent valvular heart diseases, affecting 2% of the global population, with incidence increasing significantly with age.1-4 For patients with severe symptomatic MR who are at high or prohibitive surgical risk, mitral transcatheter edge-to-edge repair (M-TEER) has become an established alternative to surgery.5 The COAPT trial demonstrated that M-TEER significantly reduces heart failure-related hospitalizations and mortality in patients with severe secondary MR receiving optimized guideline-directed optimal medical therapy.6 As M-TEER adoption has expanded, procedures are increasingly performed across hospitals with different levels of experience, structural heart infrastructure, imaging support, and referral patterns.7 In other cardiovascular interventions, an inverse relationship between procedural volume and adverse outcomes has been well described, with high-volume centers demonstrating lower mortality and fewer complications.8-11 Whether this relationship extends to M-TEER, in which procedural complexity and anatomical selection play critical roles, remains unknown. We therefore examined the association between hospital procedural volume and post-M-TEER outcomes, including mortality, readmission rates, and length of stay, using a nationally representative database. Understanding these relationships is essential to improve standardization of care across centers.
METHODS
Data source
We utilized the National Readmission Database (NRD) from January 2014 to December 2019 to conduct a retrospective analysis. The NRD is part of the Healthcare Cost and Utilization Project and is sponsored by the Agency for Healthcare Research and Quality of the United States.12 Covering multiple US states, it represents approximately 60% of the total US population and hospitalizations. The NRD has a well-established track record and has been widely used in studies of numerous diseases and cardiovascular procedures. Because the NRD contains no protected health information or personally identifiable data, this study was deemed exempt from Institutional Review Board approval. All analyses adhered to the Healthcare Cost and Utilization Project Data Use Agreement.
Study population
We queried the NRD using international code of diseases ICD-9 and ICD-10 codes to identify all hospitalizations for adults aged 18 years or older who underwent M-TEER between 2014–2019 (tables S1 and S2). Patient demographics, comorbidities, and hospital characteristics were extracted using established Healthcare Cost and Utilization Project coding definitions. For the 30- and 90-day analyses, patients discharged during months without complete follow-up availability were excluded.
The NRD does not contain echocardiographic information such as MR mechanism, functional vs degenerative MR, MR severity, leaflet morphology, coaptation depth, or postprocedural MR reduction. Accordingly, differentiation between functional and degenerative MR was not possible. Given procedural adoption patterns during the study period, the cohort likely reflects predominantly functional MR; however, this limitation affects the generalizability of the findings to M-TEER for degenerative MR.
Hospital volume stratification
Annualized hospital procedural volume was calculated as the total number of M-TEER procedures performed at each hospital from 1 January through 31 December of each year from 2014 to 2019. Hospitals were categorized into 3 groups according to the distribution of annual procedural volumes, consistent with previous volume-outcome analyses in structural heart interventions.11 Hospital-volume categories were defined using quartile-based annual procedural-volume cutoffs, with the middle 2 quartiles combined to ensure an adequate sample size and to capture clinically meaningful gradients in institutional experience: low-volume hospitals were defined as quartile 1, with < 13 M-TEER procedures per year; medium-volume hospitals as quartiles 2 and 3, with 14 to 54 procedures per year; and high-volume hospitals as quartile 4, with ≥ 55 procedures per year.
Endpoints
The primary endpoints were in-hospital events, including mortality, stroke, acute kidney injury, vascular complications, cardiogenic shock, and cardiac arrest, as well as in-hospital procedures such as implantation of multiple clips during the same index procedure, repeat clip implantation after the index procedure during the same admission, surgical mitral valve replacement (SMVR), and use of mechanical circulatory support. Secondary endpoints included 30-day readmission and 30-day inpatient mortality, defined as death during the index admission or any subsequent hospitalization within 30 days. A composite adverse outcome was defined as in-hospital mortality, repeat M-TEER during the index hospitalization, or SMVR.
Statistical analysis
We evaluated the association between procedural volume and clinical outcomes by categorizing annualized procedural volume into low-, medium-, and high-volume groups. Baseline comorbidities, hospital characteristics, and clinical outcomes were compared across volume groups using the chi-square test for categorical variables and the Kruskal–Wallis H test for continuous variables. To examine the relationship between procedural volume, as a categorical variable, and endpoints, we used multivariable logistic regression.
A set of clinically significant variables was selected a priori on the basis of presumed impact and clinical importance and was incorporated as covariates into the regression models. Multivariable models were adjusted for age, sex, median household income quartile, primary payer/insurance type, hospital bed size, and Elixhauser comorbidity components.
To examine nonlinear relationships between annual hospital M-TEER volume and the composite endpoint, we used models incorporating restricted cubic splines. These models assessed the association between procedural volume, treated as a continuous variable, and the weight-adjusted composite endpoint. The relationship was visualized by plotting the adjusted odds ratio (aOR) and 95%CI for the composite endpoint on the y-axis against procedural volume on the x-axis.
All statistical analyses were performed using STATA 18 (StataCorp LLC, United States); P values < .05 were considered statistically significant.
RESULTS
Admission characteristics
Of the 33 980 patients who underwent M-TEER between 2014-2019, 1054 (3.1%), 11 734 (34.5%), and 21 192 (62.4%) were treated at low-, medium-, and high-volume hospitals respectively. The number of hospitals performing M-TEER increased substantially during the study period, as shown in figure 1A, with growth observed across all volume categories.
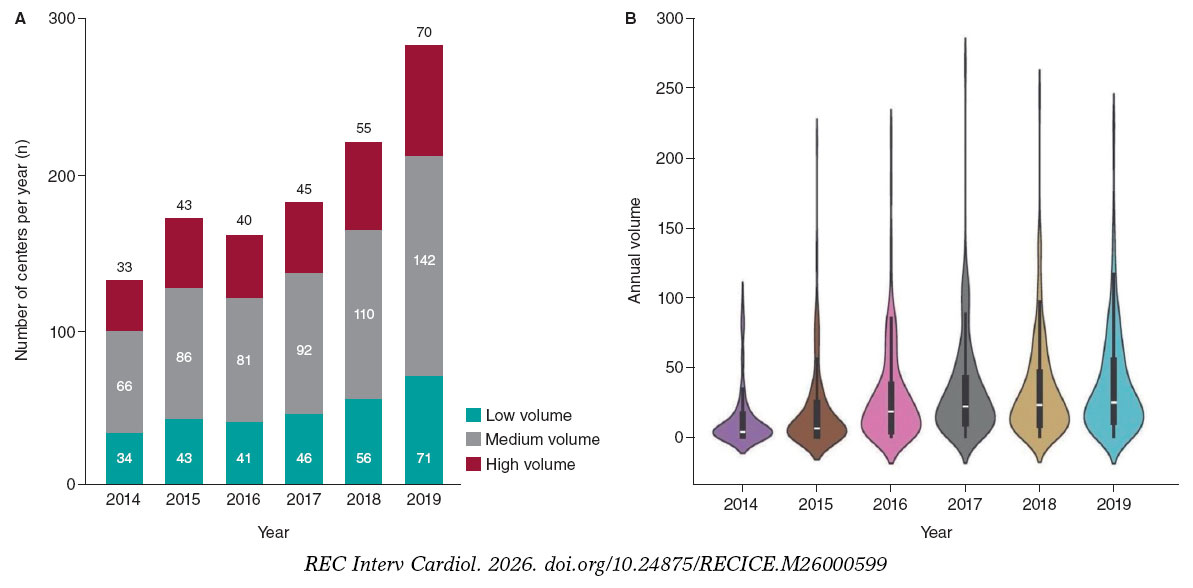
Figure 1. A: trends in United States hospitals performing mitral transcatheter edge-to-edge repair; B: annual distribution of procedural volumes per center.
Figure 1B illustrates the annual distribution of M-TEER procedural volumes across US centers from 2014 through 2019. During this period, procedural uptake increased, and the distribution widened, reflecting greater heterogeneity in practice. A bimodal pattern emerged, with a dense lower peak representing low-volume centers, defined as < 13 M-TEER procedures per year, and a sparse upper tail representing high-volume centers, defined as ≥ 55 M-TEER procedures per year.
Regarding demographics, there was a marginal difference in the proportion of female patients across hospital-volume groups (43.4%, 46.4%, and 46.2% in the low-, medium-, and high-volume hospitals, respectively; however, this difference was not statistically significant (P = .46). However, age increased significantly from low- to high-volume hospitals (75.1 ± 12.1; 77.3 ± 10.9; and 77.7 ± 10.2 years, respectively, P < .01). Payment sources varied substantially across hospital-volume groups, with different proportions of Medicare, Medicaid, private insurance, self-pay, and other payment categories (P < .01). Regarding hospital characteristics, the proportion of teaching hospitals increased from low- to high-volume hospitals (85.0%, 88.7%, 91.6%, respectively: P = .16).
When comorbidities were examined, notable differences were observed across tertiles. For example, the prevalence of coronary artery disease increased substantially from low- to high-volume hospitals: 62.3%, 64.5%, and 68.3%, respectively; P < .01. Similarly, liver disease differed significantly across groups, with the highest prevalence observed in high-volume hospitals: 10.9%, 8.8%, and 12.3%, respectively; P = .02. Furthermore, other comorbidities, including atrial fibrillation, chronic kidney disease, chronic obstructive pulmonary disease, diabetes mellitus, congestive heart failure, hyperlipidemia, hypertension, prior coronary artery bypass grafting, prior percutaneous coronary intervention, peripheral vascular disease, and smoking demonstrate varying prevalence across hospital- volume groups, as shown in table 1.
Table 1. Baseline characteristics
| Variables | Low volume (n = 1054) | Medium volume (n = 11 734) | High volume (n = 21 192) | P |
|---|---|---|---|---|
| Demographics | ||||
| Female | 457 (43.4%) | 5446 (46.4%) | 9790 (46.2%) | .46 |
| Age, years | 75.1 ± 12.1 | 77.3 ± 10.9 | 77.7 ± 10.2 | < .01 |
| Baseline comorbidities | ||||
| Atrial fibrillation | 623 (59.1%) | 7214 (61.5%) | 12 926 (61.0%) | .58 |
| Coronary artery disease | 656 (62.3%) | 7567 (64.5%) | 14 478 (68.3%) | < .01 |
| Chronic kidney disease, any | 932 (88.5%) | 10 577 (90.1%) | 18 993 (89.6%) | .62 |
| COPD | 300 (28.5%) | 3242 (27.6%) | 6272 (29.6%) | .25 |
| Diabetes mellitus | 448 (42.5%) | 5232 (44.6%) | 9603 (45.3%) | .51 |
| Congestive heart failure | 839 (79.6%) | 9830 (83.8%) | 17 888 (84.4%) | .17 |
| Hyperlipidemia | 606 (57.5%) | 7421 (63.2%) | 13 440 (63.4%) | .16 |
| Hypertension | 867 (82.2%) | 9847 (83.9%) | 17 907 (84.5%) | .47 |
| Liver disease | 115 (10.9%) | 1038 (8.8%) | 2607 (12.3%) | .02 |
| Prior CABG | 190 (18.1%) | 2376 (20.3%) | 4720 (22.3%) | < .01 |
| Prior PCI | 180 (17.1%) | 2093 (17.8%) | 3872 (18.3%) | .72 |
| Peripheral vascular disease | 148 (14.0%) | 1877 (16.0%) | 3861 (18.2%) | .12 |
| Smoker | 348 (33.1%) | 4028 (34.3%) | 6917 (32.6%) | .19 |
| Hospital characteristics | ||||
| Teaching hospital | 896 (85.0%) | 10 410 (88.7%) | 19 422 (91.6%) | .16 |
| Bed size | ||||
| Small | 93 (8.8%) | 358 (3.1%) | 959 (4.5%) | .21 |
| Medium | 314 (29.8%) | 2357 (20.1%) | 4281 (20.2%) | |
| Large | 646 (61.3%) | 9018 (76.9%) | 15 952 (75.3%) | |
| Ownership/control | ||||
| Government | 141 (13.3%) | 1488 (12.7%) | 1227 (5.8%) | < .01 |
| Private, nonprofit | 744 (70.6%) | 9198 (78.4%) | 17 322 (81.7%) | |
| Private, investor-owned | 169 (16.0%) | 1048 (8.9%) | 2643 (12.5%) | |
| Payment | ||||
| Medicare | 839 (79.7%) | 10 162 (86.6%) | 18 522 (87.4%) | < .01 |
| Medicaid | 35 (3.3%) | 327 (2.8%) | 487 (2.3%) | |
| Private | 143 (13.5%) | 983 (8.4%) | 1852 (8.7%) | |
| Self-paid | < 11 | 49 (0.4%) | 91 (0.4%) | |
| Other | 26 (2.5%) | 207 (1.8%) | 233 (1.8%) | |
|
Patients were grouped according to annual hospital M-TEER volume. Categorical variables are expressed as n (%), and age as mean ± SD. CABG, coronary artery bypass graft; COPD, chronic obstructive pulmonary disease; PCI, percutaneous coronary intervention; SD, standard deviation; M-TEER, mitral transcatheter edge-to-edge repair. |
||||
Short term outcomes
In-hospital and 30-day outcomes
Unadjusted in-hospital and 30-/90-day outcomes according to hospital volume are summarized in table 2. A detailed analysis of in-hospital and 30-day outcomes, adjusted for baseline characteristics and comorbidities, is provided in table 3. Regarding in-hospital mortality, no statistically significant differences were observed between low- or medium-volume hospitals and high-volume hospitals, as shown in figure 2. However, 30-day mortality was significantly higher in both low-volume hospitals (aOR, 1.65; 95%CI, 1.05–2.61; P = .03) and medium-volume hospitals (aOR, 1.31; 95%CI, 1.02–1.68; P = .03) compared with high-volume centers.
Table 2. Clinical outcomes
| Variables | Low volume (n = 1054) | Medium volume (n = 11 734) | High volume (n = 21 192) | P |
|---|---|---|---|---|
| In-hospital outcomes | ||||
| In-hospital mortality | 36 (3.4%) | 295 (2.5%) | 480 (2.1%) | .09 |
| Stroke | 15 (1.4%) | 123 (1.1%) | 320 (1.4%) | .25 |
| Acute kidney injury | 265 (25.2%) | 2233 (19.0%) | 5072 (22.6%) | < .01 |
| Vascular complications | 56 (5.3%) | 552 (4.7%) | 1804 (8.5%) | < .01 |
| Cardiogenic shock | 92 (8.8%) | 542 (4.6%) | 967 (4.6%) | < .01 |
| Cardiac arrest | 78 (7.4%) | 681 (5.8%) | 2074 (9.3%) | < .01 |
| In-hospital procedures | ||||
| Coronary angiography | 215 (20.4%) | 1859 (15.4%) | 4548 (20.3%) | < .01 |
| Percutaneous coronary intervention | 79 (7.5%) | 711 (5.9%) | 2156 (9.6%) | < .01 |
| Multiple clips placed during the same procedure | < 11 | 293 (2.5%) | 269 (1.3%) | < .01 |
| Repeat M-TEER procedure duing the same admission | < 11 | 25 (0.2%) | 57 (0.3%) | .71 |
| Surgical mitral valve replacement | 14 (1.3%) | 68 (0.6%) | 94 (0.4%) | .09 |
| Mechanical circulatory support | 101 (9.6%) | 799 (6.8%) | 2158 (9.6%) | .03 |
| 30-/90-day outcomes | ||||
| 30-day inpatient mortality | 41/930 (4.4%) | 313/10 938 (2.9%) | 449/20 420 (2.2%) | < .01 |
| 30-day readmission | 164/893 (18.3%) | 1639/10 647 (15.4%) | 2895/19 976 (14.5%) | .05 |
| 90-day inpatient mortality | 40/678 (5.9%) | 411/8563 (4.8%) | 700/15 556 (4.5%) | .41 |
| 90-day readmission | 154/678 (17.9%) | 1588/10 379 (15.3%) | 2736/19 000 (14.4%) | .56 |
| Repeat procedure within 90 days | < 11 | 72/12 000 (0.6%) | 185/20 556 (0.9%) | .06 |
| Hospitalization-related outcomes | ||||
| Length of stay, days | 8.6 ± 13.4 | 5.1 ± 8.8 | 5.0 ± 9.6 | < .01 |
| Total hospital cost, US $ | 287 240 ± 385 240 | 222 822 ± 205 402 | 231 673 ± 227 132 | < .01 |
| Discharge disposition | ||||
| Home, self-care | 648 (61.5%) | 7816 (66.6%) | 14 935 (70.5%) | < .01 |
| Short-term rehabilitation | 13 (1.2%) | 22 (0.2%) | 92 (0.4%) | |
| Skilled nursing facility | 151 (14.3%) | 1166 (9.9%) | 1916 (9.0%) | |
| Home health care | 204 (19.3%) | 2428 (20.7%) | 3793 (17.9%) | |
|
Patients were grouped according to annual hospital M-TEER volume. Data express n (%) unless otherwise indicated. Follow-up outcomes are expressed as numerator/denominator (%), and length of stay and total hospital cost as mean ± standard deviation (SD). M-TEER, mitral transcatheter edge-to-edge repair. |
||||
Table 3. Adjusted associations by hospital M-TEER volume
| Annual hospital TEER volume | ||||
|---|---|---|---|---|
| Outcome | Low (n = 1054) | Medium (n = 11 734) | High (n = 21 192) | |
| In-hospital mortality | 1.25 (0.76-2.05); P = .38 | 1.20 (0.91-1.59); P = .20 | 1 [reference] | |
| 30-day inpatient mortality | 1.65 (1.05-2.61); P = .03 | 1.31 (1.02-1.68); P = .03 | 1 [reference] | |
| 30-day readmission | 1.27 (1.00-1.61); P = .05 | 1.07 (0.96-1.18); P = .23 | 1 [reference] | |
| In-hospital stroke | 1.21 (0.65-2.29); P = .55 | 0.79 (0.56-1.11); P = .19 | 1 [reference] | |
| In-hospital cardiac arrest | 0.72 (0.46-1.15); P = .17 | 0.59 (0.40-0.87); P < .01 | 1 [reference] | |
| Vascular complications | 0.59 (0.35-1.00); P = .05 | 0.55 (0.35-0.86); P = .01 | 1 [reference] | |
| Multiple clips during the same procedure | 0.56 (0.22-1.44); P = .23 | 2.05 (1.28-3.29); P < .01 | 1 [reference] | |
| Repeat M-TEER during same admission | 1.03 (0.24-4.36); P = .97 | 0.94 (0.48-1.84); P = .85 | 1 [reference] | |
| Repeat M-TEER in 90 days | 0.33 (0.08-1.32); P = .12 | 0.94 (0.48-1.84); P = .85 | 1 [reference] | |
| SMVR | 2.37 (0.94-3.00); P = .07 | 1.26 (0.62-2.56); P = .52 | 1 [reference] | |
| MCS | 0.85 (0.56-1.30); P = .45 | 0.66 (0.46-0.95); P = .03 | 1 [reference] | |
| Acute kidney injury | 1.06 (0.82-1.37); P = .67 | 0.77 (0.64-0.93); P < .01 | 1 [reference] | |
|
Values are adjusted odds ratios (95% confidence interval) with P values; high-volume hospitals are the reference group. The 30-day primary endpoints were 30-day inpatient mortality and 30-day readmission; procedural and safety endpoints are exploratory. MCS, mechanical circulatory support; M-TEER, mitral transcatheter edge-to-edge repair; OR, odds ratio; SMVR, surgical mitral valve replacement. |
||||
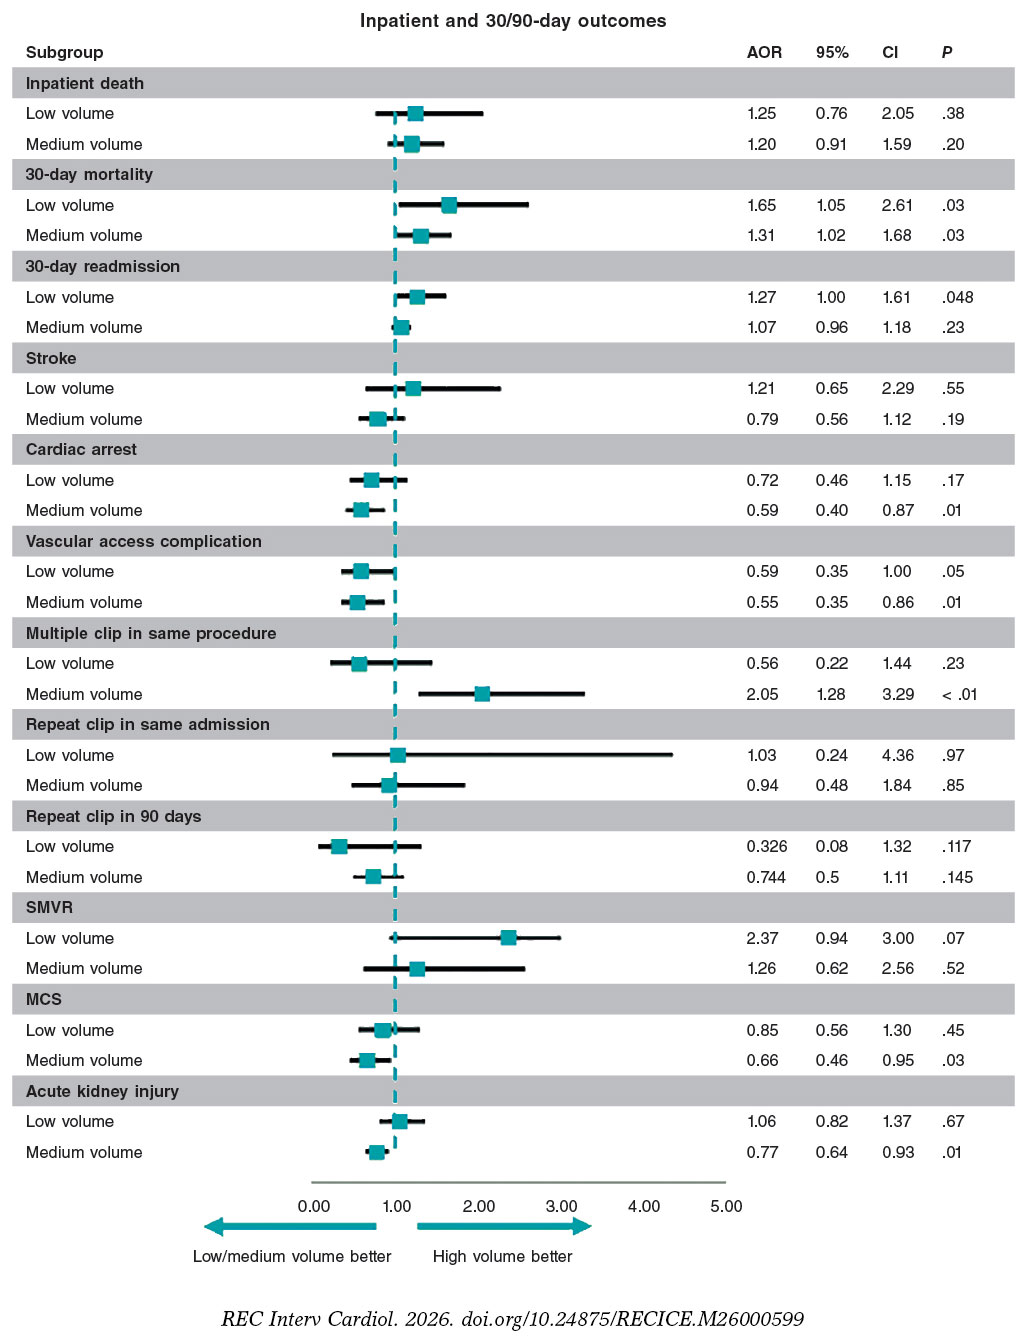
Figure 2. Procedural volume and clinical outcomes of mitral transcatheter edge-to-edge repair (M-TEER). 95%CI, 95% confidence interval; aOR, adjusted odds ratio; MCS, mechanical circulatory support; SMVR, surgical mitral valve replacement.
In addition, patients treated at low-volume hospitals had significantly higher 30-day readmission rates (aOR, 1.27; 95%CI, 1.00–1.61; P = .048), whereas medium-volume hospitals did not differ significantly in readmission risk. Importantly, there were no significant differences in repeat M-TEER during the same admission or within 90 days, and no difference was observed in the incidence of SMVR across hospital-volume groups. A visual summary of these adjusted outcomes, including procedural and safety endpoints, is provided in figure 3.
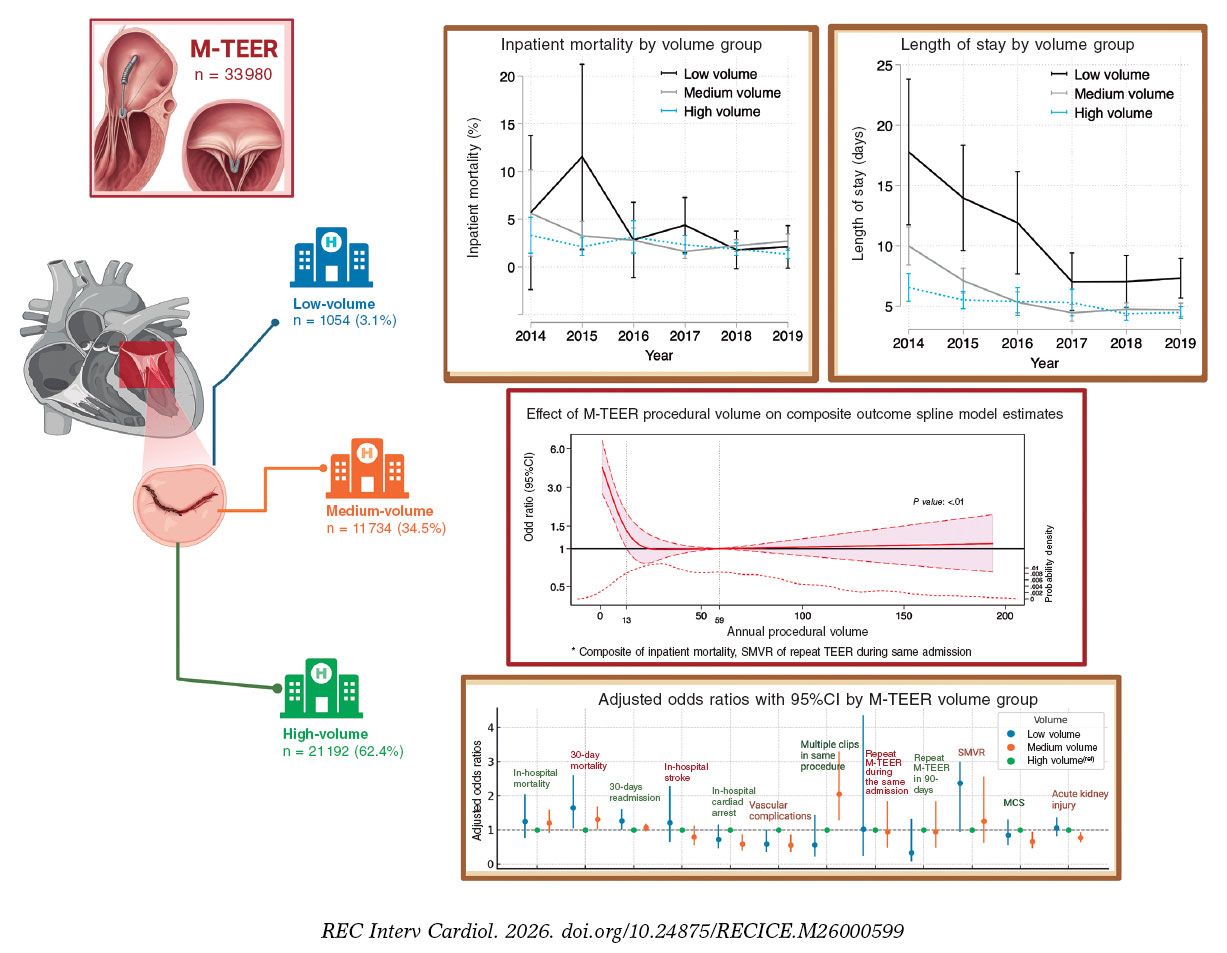
Figure 3. Central illustration. In-patient and 30/90-day outcomes of mitral transcatheter edge-to-edge repair procedures. aOR, adjusted odds ratio; MCS, mechanical circulatory support; SMVR, surgical mitral valve replacement.
Procedural volume
Notably, patients treated at low-volume hospitals had lower odds of receiving multiple clips during the same procedure (aOR, 0.56; 95%CI, 0.22-1.44; P = .23), whereas those treated at medium-volume hospitals had higher odds of receiving multiple clips (aOR, 2.05; 95%CI, 1.28-3.29; P < .01) compared with high-volume centers. Moreover, low-volume hospitals showed lower odds of vascular complications (aOR, 0.59; 95%CI, 0.35-1.00; P = .049) compared with high-volume centers. Acute kidney injury, although not significantly different between low- and high-volume hospitals, was significantly less frequent in medium-volume hospitals (aOR, 0.77; 95%CI, 0.64-0.93; P < .01). The use of mechanical circulatory support was less likely in medium-volume hospitals (aOR, 0.66; 95%CI, 0.46-0.95; P = .026) compared with high-volume hospitals. In-hospital stroke, in-hospital cardiac arrest, and the incidence of SMVR did not differed significantly across low-, medium-, and high-volume hospitals. Finally, the restricted cubic spline analysis model demonstrated a significant nonlinear association between annual M-TEER procedural volume and the odds of the composite adverse outcome. The odds of the adverse outcome were highest at lower procedural volumes and declined steeply up to approximately 12 to 13 procedures per year, after which the association plateaued near the reference value. Formal testing demonstrated both a significant overall association between procedural volume and the outcome (P < .001 for overall association) and significant nonlinearity (P < .01 for nonlinearity; figure 2).
Length of stay
During the study period, the length of stay for M-TEER procedures decreased, with the greatest reduction observed in low-volume centers. Despite this overall decrease, low-volume centers consistently had the longest length of stay throughout the study period, as shown in figure 2.
DISCUSSION
In our study, we used the NRD to perform a national analysis of the volume-outcome relationship in M-TEER. Among 33,980 M-TEER procedures performed between 2014 and 2019, we observed that high-volume centers accounted for 63% of the overall volume and that adjusted 30-day mortality and readmission were significantly higher in low-volume centers. Furthermore, length of stay was consistently longest in low-volume hospitals.
Approximately two-thirds of cases were performed in high-volume hospitals, whereas 3.1% were performed in low-volume hospitals. This notable variation in case numbers across M-TEER centers may be attributable to established referral networks, leading to a distribution of cases toward somce centers rather than others.13 A similar finding was reported in the 2019 study by Chhatriwalla et al., which examined institutional experience and M-TEER outcomes and noted that, owing to the referral system, several years would be required for low-volume institutions to achieve the number of cases required to reach the experience threshold.13
Of note, the NRD does not capture echocardiographic parameters such as MR mechanism, leaflet morphology, or postprocedural MR reduction. Because M-TEER during this period was predominantly performed for functional MR, the cohort likely reflects mostly functional MR cases; however, the inability to stratify by MR etiology limits assessment of how anatomic complexity influenced outcomes.
Low-volume centers demonstrated higher adjusted 30-day mortality, although in-hospital mortality remained low across all groups. This finding is consistent with data from a Japanese registry, reporting in-hospital mortality of < 5% among patients undergoing M-TEER for secondary mitral regurgitation.14
A strength of this study is the evaluation of outcomes beyond inpatient mortality, including readmission and length of stay. These metrics suggest that differences in procedural volume may influence recovery and postdischarge care. Our findings, together with previous work by Chhatriwalla et al., reinforce the inverse volume–outcomes relationship observed in other structural heart procedures.13
Institutional resources and infrastructure at higher-volume centers may play a crucial role in influencing outcomes. High-volume centers are more likely to have established protocols, heart teams, and specialized facilities dedicated to transcatheter procedures.9,13,15 These resources may support a more streamlined care process and facilitate comprehensive patient selection, which could contribute to the observed differences in outcomes. Identifying and standardizing best practices from high-volume centers could be instrumental in improving outcomes in low-volume settings.
Furthermore, the disparities observed in readmission rates and length of stay between low- and high-volume hospitals raise questions about differences in postoperative care and coordination. Low-volume centers may face challenges in managing post-discharge issues or ensuring consistent follow-up, which could contribute to higher readmission rates and longer hospitalizations. The finding that in-hospital complication rates were similar whereas 30-day outcomes differed suggests that variations in postdischarge care, including follow-up coordination, access to heart failure services, and timely recognition of clinical deterioration, may play a role. The inverse volume-outcome association observed in our study aligns with previous research demonstrating similar patterns for various cardiac procedures, such as transcatheter aortic valve replacement, percutaneous coronary intervention, and surgical mitral valve repair, as well as noncardiac procedures, including surgery for heptopancretobiliary disease, colon cancer, and endocrinopathies.16-21
A key factor influencing outcomes between low- and high-volume centers is the variation in operator experience and expertise. High-volume centers are more likely to have a team of operators who routinely perform M-TEER procedures, thereby accumulating experience and refining their skills. In contrast, low-volume centers may lack the same level of exposure and experience. This may contribute to the higher rates of procedural complications and adverse events observed in lower-volume centers. Although operator volume is known to independently influence M-TEER outcomes, operator identifiers are not available in the NRD; thus, we were unable to adjust for operator-level procedural experience, representing an important source of unmeasured confounding. Our dataset does not allow us to directly assess whether higher-volume centers achieve greater M-TEER success, because specific measures of mitral regurgitation improvement are unavailable. Instead, we relied on indirect indicators, such as conversion to surgery, readmission, and repeat procedures, which are also influenced by differences in patient selection across centers. For instance, low-volume centers may treat lower-risk or less complex patients, whereas high-volume centers may treat patients with more complex anatomy, thereby influencing immediate procedural decisions and complication rates.
The need for multiple clips during a single TEER procedure and the occurrence of repeat M-TEER provide significant insights into the complexity and effectiveness of mitral valve repair strategies. Our analysis showed that medium-volume hospitals had higher odds of using multiple clips (aOR, 2.05; 95%CI, 1.28-3.29; P < .01) compared with high-volume centers. This pattern may reflect differences in procedural strategy, anatomical complexity, or operator learning curves rather than procedural inefficiency. Without echocardiographic variables, the precise mechanism contributing to this observation cannot be determined. The need for multiple clips often arises from the challenge of achieving adequate mitral valve coaptation, particularly in complex cases in which a single clip may not be suffice. It is difficult to determine whether patient selection, anatomical complexity, or procedural experience contributed to this difference. However, the rate of repeat M-TEER during the same admission and within 90 days did not show differ significantly between hospital-volume groups, suggesting that although initial M-TEER procedures may be technically demanding, the need for repeat interventions may not vary substantially according to hospital experience.
With the increase in M-TEER centers nationally, determining which patients should undergo M-TEER or SMVR can become more challenging, particularly among patients who may be eligible for both procedures. SMVR is a surgical procedure associated with an increased risk of complications and adverse events, and M-TEER for functional MR with reduced left ventricular ejection fraction has previously been shown to have lower perioperative complications and mortality than SMVR.22 Feldman et al. and Stone et al. also demonstrated the safety and efficacy profile of the MitraClip system (Abbott Vascular, Unites States) for M-TEER.6,23 However, just as with clinical experience has contributed to improved SMVR outcomes and success, the proficiency and experience of the medical facility and operator are important factors associated with M-TEER outcomes.9,13,24-28
Recent advances in M-TEER with MitraClip have expanded treatment options for patients undergoing mitral valve repair. However, our study, as well as previous studies, suggests that referral of patients to higher-volume centers with more experienced operators is associated with improved outcomes.9,13 To achieve optimal and consistent patient care and outcomes across hospitals with different procedural volumes, assessment and standardization training and procedural standards for M-TEER with MitraClip may be necessary.
Although differences may exist between high- and low-volume centers, certain outcomes showed no significant disparities. In-hospital stroke, in-hospital cardiac arrest, and the incidence of SMVR remained consistent across all volume groups. Notably, vascular complications outcomes favored low-volume centers compared with high-volume centers. In addition, medium-volume hospitals showed a significant reduction in acute kidney injury compared with both low and high-volume hospitals. Differences in mechanical circulatory support use across volume groups likely reflect institutional resource availability and differing thresholds for mechanical support rather than inherent procedural differences, because high-volume centers may treat a greater proportion of hemodynamically complex patients.
Although it may be assumed that factors like acute kidney injury and vascular complications in high-volume centers could be associated with increased trainee activity, leading to higher rates of vascular access complications and greater contrast use,29 previous studies have shown that only fluoroscopy time tends to increase with trainee involvement, whereas vascular access complications remain comparable when trainees are supervised.29-31 Interestingly, although high-volume centers had a higher proportion of teaching hospitals, this difference was not statistically significant and was accounted for in our adjusted analysis. This finding suggests that the observed outcomes in high-volume centers cannot solely be attributed to trainee involvement. Moreover, higher rates of mechanical circulatory support and permanent pacemaker placement in high-volume centers likely reflect the greater availability of these devices and the treatment of more complex patients undergoing M-TEER.
Taken together, these findings highlight the complex interplay between institutional volume, operator experience, patient selection, and periprocedural practices, which cannot be fully disentangled using administrative data alone.
Real-world application of findings
The disparities in M-TEER procedure outcomes observed in our study prompt further exploration of the potential mechanisms underlying the volume-outcome relationship. Factors such as operator experience, institutional resources, and adherence to best practices may contribute to these differences. Investigation of these aspects is crucial to better understand underlying mechanisms and to develop targeted interventions aimed at improving outcomes across hospitals with different procedural volumes. This understanding is imperative for guiding future research directions and improving outcomes in low-volume centers.
The implications of our findings extend to health care policy and resource allocation. If low-volume centers consistently show inferior outcomes, policymakers may need to consider consolidation of selected procedures at higher-volume centers or provide additional support to improve low-volume institutions. However, such decisions must balance patient access, geographic distribution, and overall health care system capacity. As transcatheter interventions continue to evolve, ongoing monitoring of the volume-outcome relationship is essential. Longitudinal studies tracking outcomes, including technological advances and changes in practice, will offer a more comprehensive understanding. Collaborative efforts among professional societies, regulatory bodies, and health care providers are crucial to developing evidence-based guidelines for clinical practice and reducing disparities across hospital-volume groups.
Limitations
Our study has several limitations. First, as an observational analysis of NRD administrative data, it cannot establish causality, and residual confounding may persist. Second, the absence of data on postdischarge clinic visits or specialist follow-up may have influenced readmission mortality rates after the index hospitalization. Third, the NRD excludes interstate hospitalizations and lacks patient data linkage across years, which may affect readmission estimates. In addition, the NRD does not include echocardiographic information such as MR mechanism, functional vs degenerative MR, MR severity, leaflet morphology, coaptation depth, pulmonary pressures, or postprocedural MR reduction. As a result, we were unable to stratify outcomes by MR etiology or evaluate anatomical procedural success, both of which are important determinants of M-TEER complexity. This limitation may influence interpretation of the volume–outcome relationships.
Fourth, the results primarily reflect outcomes related to M-TEER for functional MR, because functional MR M-TEER was adopted before degenerative MR M-TEER during the study period. Consequently, the findings may not be directly applicable to M-TEER procedures for degenerative MR. However, this focus on functional MR may have contributed to sample homogeneity, thereby enhancing the consistency and comparability of the results. Another important limitation is that the NRD does not provide operator-level identifiers. Therefore, we could not adjust for operator procedural experience, which previous studies have shown to independently influence M-TEER outcomes. This unmeasured factor may contribute to differences observed across hospital-volume strata. Fifth, the use of ICD codes for administrative data analysis introduces the possibility of errors. Notably, while coding changed from ICD-9 to ICD-10 in 2015, this transition is unlikely to have substantially affected the proportion of readmissions. In addition, the inclusion of more states to the NRD enhances national representation without substantially affecting readmission proportions. The NRD does not capture readmissions across states; however, this is likely inconsequential because very few patients would be expected to be readmitted in a state other than that in which the procedure was performed. Sixth, 30-day mortality captured in the NRD reflects inpatient mortality only, because the database does not include out-of-hospital deaths. This may underestimate true 30-day mortality, particularly in centers with shorter lengths of stay and earlier discharge practices. Seventh, patient selection bias represents an important concern: high-volume centers may treat patients with more complex anatomy and a higher comorbidity burden, whereas low-volume centers may manage more selected, lower-risk cases. This differential selection could influence the observed volume–outcome association and cannot be fully addressed without anatomical and echocardiographic data. Eighth, the study period, from 2014 to 2019, predates the broader expansion of M-TEER to degenerative MR and reflects an era of earlier-generation devices and evolving learning curves. The volume thresholds and outcome patterns observed may therefore not be directly applicable to contemporary practice, in which device technology, operator training pathways, and procedural indications have evolved substantially. Ninth, our analysis examined multiple outcomes across 3 hospital-volume strata, raising the possibility of multiple comparisons. Thirty-day inpatient mortality and 30-day readmission were prespecified as the primary endpoints, whereas procedural variables, in-hospital safety events, 90-day outcomes, costs, and discharge disposition were considered exploratory and interpreted descriptively. We did not apply a formal multiplicity adjustment, such as Bonferroni or Benjamini–Hochberg correction, which is consistent with the hypothesis-generating nature of observational volume–outcome studies, in which effect size, confidence interval precision, biological plausibility, and consistency with previous literature are central to interpretation. However, some exploratory associations may not remain statistically significant after formal correction and should not be interpreted as confirmatory. Validation in registries with operator-level and echocardiographic data, ideally using prespecified outcome hierarchies, is needed before any specific association can be considered established.
Finally, certain anatomic and clinical features that influence M-TEER outcomes, such as left ventricular size, valvular anatomy, leaflet thickness, and overall complexity, cannot be captured in the NRD. Differential patient selection at low- and high-volume centers may therefore contribute to residual confounding. The absence of race data in the NRD also limits assessment of racial disparities in readmission. Furthermore, the NRD captures data at the hospitalization level and lacks individual patient-level details, such as specific procedural information and long-term follow-up.
CONCLUSIONS
The number of centers performing M-TEER increased substantially during the study period, with procedural adoption extending across hospitals with varying procedural volumes. However, an inverse relationship was observed between procedural volume and 30-day outcomes, with higher mortality and readmission rates at low-volume hospitals than at high-volume centers. Although detailed anatomical and operator-level information was not available in this dataset, the consistency of these findings with previous work highlights the importance of institutional experience and coordinated periprocedural care. Continued efforts to standardize protocols, optimize training, and support developing M-TEER programs may help reduce disparities and improve outcomes across hospital volumes.
FUNDING
No funding was received for this study.
ETHICAL CONSIDERATIONS
This study used deidentified HCUP-NRD data and was deemed exempt from institutional review board review; informed consent was not required because no individual patient data are reported. All analyses complied with the HCUP Data Use Agreement. With respect to SAGER guidance, sex was included in the analysis where available; gender identity is not captured in the NRD, which limits assessment of gender-related bias.
STATEMENT ON THE USE OF ARTIFICIAL INTELLIGENCE
No generative artificial intelligence tools were used to create, analyze, or interpret the data. Artificial intelligence was used only for limited language editing of selected sections; all scientific content, analyses, conclusions, and final approval are the sole responsibility of the authors.
AUTHORS’ CONTRIBUTIONS
Concept and design: F. Ghanem, L. Alhuneafat, O. Obeidat, and A. Sharma. Acquisition, analysis, or interpretation of data: all authors. Drafting of the manuscript: F. Ghanem, L. Alhuneafat, O. Obeidat, A. Elhamdani, and T. Tarawneh. Critical revision of the manuscript for important intellectual content: A. Naser, A. Asassfeh, R.M. Hatttab, A. Jabri, A. Al Turk, S. Gurevich, P. Villablanca, and A. Sharma. Statistical analysis: F. Ghanem and L. Alhuneafat. Supervision: A. Sharma and P. Villablanca. All authors read and approved the final manuscript.
CONFLICTS OF INTEREST
None declared.
WHAT IS KNOWN ABOUT THE TOPIC?
- M-TEER is an established treatment option for patients with severe symptomatic mitral regurgitation who are at high or prohibitive surgical risk.
- M-TEER use has expanded nationwide, with procedures now performed across hospitals with different procedural volumes, experience, structural heart infrastructure, imaging support, and referral patterns.
- An inverse relationship between procedural volume and outcomes has been well described for several cardiovascular procedures, including transcatheter aortic valve replacement, percutaneous coronary intervention, and surgical mitral valve procedures.
- Whether a similar hospital volume-outcome relationship exists for M-TEER remains incompletely defined.
WHAT DOES THIS STUDY ADD?
- This study analyzed 33 980 patients who underwent M-TEER using the NRD from 2014 through 2019.
- M-TEER adoption increased substantially during the study period, with most procedures performed at high-volume hospitals.
- Low-volume hospitals had higher adjusted odds of 30-day inpatient mortality, higher 30-day readmission, and longer length of stay compared with high-volume centers.
- These findings support an inverse relationship between hospital M-TEER procedural volume and short-term outcomes.
- The study highlights the potential importance of institutional experience, standardized protocols, multidisciplinary care, and post-discharge coordination in improving outcomes across M-TEER programs.
SUPPLEMENTARY DATA

REFERENCES
1. Douedi S, Douedi H. Mitral Regurgitation. Treasure Island. StatPearls Publishing;2026. Available at:https://www.ncbi.nlm.nih.gov/books/NBK553135/. Accessed May 2024.
2. Wu S, Chai A, Arimie S, et al. Incidence and treatment of severe primary mitral regurgitation in contemporary clinical practice. Cardiovasc Revasc Med. 2018;19:960-963.
3. Asgar AW, Mack MJ, Stone GW. Secondary Mitral Regurgitation in Heart Failure. J Am Coll Cardiol. 2015;65:1231-1248.
4. Avierinos JF, Gersh BJ, Melton LJ, et al. Natural History of Asymptomatic Mitral Valve Prolapse in the Community. Circulation. 2002;106:1355-1361.
5. Otto CM, Nishimura RA, Bonow RO, et al. 2020 ACC/AHA Guideline for the Management of Patients With Valvular Heart Disease:A Report of the American College of Cardiology/American Heart Association Joint Committee on Clinical Practice Guidelines. Circulation. 2021;143:e72–e227.
6. Stone GW, Abraham WT, Lindenfeld J, et al. Five-Year Follow-up after Transcatheter Repair of Secondary Mitral Regurgitation. N Eng J Med. 2023;388:2037-2048.
7. Hausleiter J, Stocker TJ, Adamo M, Karam N, Swaans MJ, Praz F. Mitral valve transcatheter edge-to-edge repair. EuroIntervention. 2023;18:957-976.
8. Mauler-Wittwer S, Noble S. Volume-Outcome Relationship in Surgical and Cardiac Transcatheter Interventions with a Focus on Transcatheter Aortic Valve Implantation. J Clin Med. 2022;11:3806.
9. Keller K, Hobohm L, Schmidtmann I, Münzel T, Baldus S, Bardeleben RSV. Centre procedural volume and adverse in-hospital outcomes in patients undergoing percutaneous transvenous edge-to-edge mitral valve repair using MitraClip in Germany. Eur J Heart Fail. 2021;23:1380-1389.
10. Hameed I. Mitral Valve Repair:Optimal Annual Case Volume for Surgery. JACC Adv. 2025;4:101589.
11. Kumbhani DJ, Girotra S, Dong H, et al. Contemporary Operator Procedural Volumes and Outcomes for TAVR and MTEER in the US. JAMA Cardiol. 2026;11:268.
12. Healthcare Cost and Utilization Project (HCUP). Encyclopedia of Health Services Research. 2009. doi:10.4135/9781412971942.n164
13. Chhatriwalla AK. Institutional Experience With Transcatheter Mitral Valve Repair and Clinical Outcomes:Insights From the TVT Registry. JACC Cardiovasc Interv. 2019;12:1342-1352.
14. Imamura T, Tanaka S, Ushijima R, et al. Predictive Factors of Cardiac Mortality Following TEER in Patients with Secondary Mitral Regurgitation. J Clin Med. 2024;13:815.
15. Vemulapalli S, Carroll JD, Mack MJ, et al. Procedural Volume and Outcomes for Transcatheter Aortic-Valve Replacement. New Eng J Med. 2019;380:2541-2550.
16. Stavrakis AI, Ituarte PH, Ko CY, Yeh MW. Surgeon volume as a predictor of outcomes in inpatient and outpatient endocrine surgery. Surgery. 2007;142:887-899.
17. Schrag D. Influence of Hospital Procedure Volume on Outcomes Following Surgery for Colon Cancer. JAMA. 2000;284:3028.
18. Nathan H, Cameron JL, Choti MA, Schulick RD, Pawlik TM. The Volume-Outcomes Effect in Hepato-Pancreato-Biliary Surgery:Hospital Versus Surgeon Contributions and Specificity of the Relationship. J Am Coll Surg. 2009;208:528-538.
19. Bolling SF, Li S, O'Brien SM, Brennan JM, Prager RL, Gammie JS. Predictors of Mitral Valve Repair:Clinical and Surgeon Factors. Ann Thorac Surg. 2010;90:1904-1912.
20. Fanaroff AC, Zakroysky P, Wojdyla D, et al. Relationship Between Operator Volume and Long-Term Outcomes After Percutaneous Coronary Intervention. Circulation. 2019;139:458-472.
21. Salemi A, Sedrakyan A, Mao J, et al. Individual Operator Experience and Outcomes in Transcatheter Aortic Valve Replacement. JACC:Cardiovasc Interv. 2019;12:90-97.
22. Gyoten T, Schenk S, Rochor K, et al. Outcome Comparison of Mitral Valve Surgery and MitraClip Therapy in Patients with Severely Reduced Left Ventricular Dysfunction. ESC Heart Fail. 2020;7:1781-1790.
23. Braybrook C. Safety and feasibility of edge-to-edge mitral valve repair:the EVEREST trial. Nature Clin Prac Cardiovasc Med. 2006;3:10-11.
24. Chhatriwalla AK, Vemulapalli S, Szerlip M, et al. Operator Experience and Outcomes of Transcatheter Mitral Valve Repair in the United States. J Am Coll Cardiol. 2019;74:2955-2965.
25. Taramasso M, Maisano F, Latib A, et al. Clinical outcomes of MitraClip for the treatment of functional mitral regurgitation. EuroIntervention. 2014;10:746-752.
26. Toggweiler S, Zuber M, Sürder D, et al. Two-year outcomes after percutaneous mitral valve repair with the MitraClip system:durability of the procedure and predictors of outcome. Open Heart. 2014;1:e000056.
27. Ailawadi G, Lim DS, Grayburn PA. Response by Ailawadi et al to Letter Regarding Article, “One-Year Outcomes After MitraClip for Functional Mitral Regurgitation”. Circulation. 2019;140:e175-e176.
28. Rudolph V, Knap M, Franzen O, et al. Echocardiographic and Clinical Outcomes of MitraClip Therapy in Patients Not Amenable to Surgery. J Am Coll Cardiol. 2011;58:2190-2195.
29. Stolker JM, Allen DS, Cohen DJ, et al. Comparison of Procedural Complications With Versus Without Interventional Cardiology Fellows-in-Training During Contemporary Percutaneous Coronary Intervention. J Am Coll Cardiol. 2014;113:44-48.
30. Talley JD, Mauldin PD, Leesar M, Becker ER. A Prospective Randomized Trial of 0.010“Versus 0.014”Balloon PTCA Systems and Interventional Fellow Versus Attending Physician as Primary Operator in Elective PTCA:Economic, Technical, and Clinical End Points. J Interv Cardiol. 1995;8:623-631.
31. Agostoni P, Biondi-Zoccai GG, Gasparini GL, et al. Is bare-metal stenting superior to balloon angioplasty for small vessel coronary artery disease?Evidence from a meta-analysis of randomized trials. Eur Heart J. 2005;26:881-889.