ABSTRACT
Introduction and objectives: To analyze if there is an association between certain structural variables of the treating centres (availability of cardiac surgery and an intensive care unit [CICU] led by cardiologists) and the volume of procedures performed that may be impacting the results of surgical (SAVR) or transcatheter (TAVI) aortic valve treatment.
Methods: Retrospective and observational study of all patients discharged from hospitals from the Spanish National Health System who underwent a SAVR or a TAVI procedure. The source of the data was the administrative minimum basic data set. The outcome variables analyzed were in-hospital mortality, length of stay (both of them risk-adjusted), and presence of complications. As structural variables for the centers studied we used the availability of cardiac surgeries and CICU.
Results: A total of 2055 TAVI and 15 146 SAVR episodes were identified. The adjustment models for in-hospital mortality showed good discrimination (AUC for the SAVR and TAVI model: 0.84; 95%CI, 0.82-0.85) and calibration (P < .001). The model median odds ratio was 1.73, indicative of a high inter-hospital variability. High-volume hospitals, with cardiac surgery services, and CICU-capable centers had the lowest risk-adjusted mortality rate in both procedures.
Conclusions: A consistent association is observed between the structural characteristics of the treating centers and the results of aortic valve management both surgical and transcatheter. Also, the availability of a CICU could be a relevant factor in the outcomes of these procedures.
Keywords: TAVI. Volume. Results. Aortic stenosis. Surgery.
RESUMEN
Introducción y objetivos: Analizar la asociación entre algunas variables estructurales de los centros tratantes (disponibilidad de cirugía cardiaca y de unidad de cuidados intensivos cardiológicos [UCIC]), así como su volumen de procedimientos, con los resultados del reemplazo quirúrgico de válvula aórtica (RQVA) o transcatéter (TAVI).
Métodos: Estudio observacional retrospectivo de todos los pacientes dados de alta en los hospitales del Sistema Nacional de Salud español a quienes se realizó un procedimiento RQVA o TAVI en los años 2014 y 2015. La fuente de los datos fue el Conjunto Mínimo Básico de Datos. Las variables de resultados analizadas fueron la mortalidad intrahospitalaria, la duración de la estancia (ambas ajustadas por el riesgo) y la presencia de complicaciones. La disponibilidad de cirugía cardiaca y la disponibilidad de UCIC se utilizaron como variables estructurales de los centros.
Resultados: Se analizaron 2.055 TAVI y 15.146 RQVA. Los modelos de ajuste para la mortalidad intrahospitalaria mostraron una buena discriminación (área bajo la curva ROC para el modelo conjunto de TAVI y RQVA: 0,84; IC95%, 0,82-0,85) y calibración (p < 0,001). La odds ratio mediana del modelo fue de 1,73, lo que señala una elevada variabilidad interhospitalaria. Los hospitales con mayor volumen de actividad, con servicio de cirugía cardiaca y dotados de UCIC muestran menor mortalidad ajustada al riesgo en ambos procedimientos.
Conclusiones: Se observa una asociación consistente entre las características estructurales de los centros tratantes y los resultados del reemplazo valvular aórtico, tanto quirúrgico como transcatéter. Además, la disponibilidad de UCIC podría ser un factor relevante en los resultados de dichos procedimientos.
Palabras clave: TAVI. Volumen. Resultados. Estenosis aórtica. Cirugía.
Abbreviations
RA-SMR: risk-adjusted standardized mortality ratio. RA-LOSR: risk-adjusted length of stay ratio. MBD: minimum basic dataset. SAVR: surgical aortic valve replacement. TAVI: transcatheter aortic valve implantation.
INTRODUCTION
Severe aortic stenosis is a common disease in our setting and has high morbidity and mortality rate. Its basic treatment is valve replacement.1 Over the last 2 decades, transcatheter aortic valve implantation (TAVI) has joined the traditional surgical aortic valve replacement (SAVR).2
Data are clear on the association between results and certain characteristics of the centers. The fact that has been most described in the medical literature is that, regarding mortality and complications, better results are obtained in those centers that reach the activity threshold (per center and per operator) for certain processes and procedures,3-7 including coronary artery bypass graft (CABG)5,8 and primary angioplasty.9-11 Regarding TAVI, the association between volume and results has been reported in hospitals in the United States.12-14 In Germany, this association is less obvious.15 In Spain, the association between volume and results has also been reported for CABG.16
There are fewer studies that analyze the structural characteristics of the centers and their association with the characteristics of the healthcare systems of every country and the results obtained. In Spain, Bertomeu et al.17 found a lower mortality rate in patients with acute myocardial infarction (AMI) in high-volume centers with higher complexity. Worner et al.18 described a lower mortality rate in the management of AMI in hospitals with cardiac surgery and intensive care unit (CICU) capabilities. Rodríguez-Padial et al.19 found better results in the management of AMI in hospitals serving large communities. The association between CICU availability and better results has also been reported in our setting for the management of cardiogenic shock due to ST-segment elevation myocardial infarction.20
Our objective was to analyze the structural variables of the treating centers (availability of CICU), the volume of procedures performed and their association with results obtained after aortic valve replacement (whether through TAVI or SAVR).
METHODS
Population and sources of data
This is an observational and retrospective study of all the patients discharged from the hospitals of the Spanish National Healthcare System who underwent a SAVR o a TAVI procedure. The source of data was the minimum basic dataset (MBD) of the Spanish National Healthcare System of 2014 and 2015 (the only years available with a specific code for TAVI in the MBD). The clinical results of the patients transferred were assigned to the centers from which they were eventually discharged. Whenever the same episode was treated through TAVI and SAVR, it was considered as a TAVI treated episode and SAVR as a TAVI related complication. The main result variables were in-hospital mortality, length of the hospital stay, and in-hospital complications. The codes used for the complications seen are shown on table 1 of the supplementary data.
Table 1. Differences in the profile of patients and in the results of transcatheter aortic valve implantation based on the structural characteristics of each center (2014-2015)
| Type 3 hospitals | Type 4 hospitals | ||||
|---|---|---|---|---|---|
| Non-CICU | CICU | Non-CICU | CICU | P | |
| Number of episodes | 85 | 25 | 865 | 1064 | |
| Age | 81.3 ± 5.9 | 82.4 ± 2.5 | 80.6 ± 6.9 | 80.8 ± 6.8 | .408 |
| Sex | 54.1 | 44 | 52.1 | 50.4 | .705 |
| Charlson index | 7.6 ± 1.5 | 7.2 ± 1.8 | 7.1 ± 1.6 | 7.3 ± 1.7 | .022 |
| Cardiogenic shock | 1.2 | 0.0 | 0.8 | 1.1 | .854 |
| Previous percutaneous transluminal coronary angioplasty | 12.9 | 24.0 | 20.6 | 15.7 | .02 |
| Infectious endocarditis | 0.0 | 0.0 | 0.1 | 0.2 | .952 |
| CABG in the episode | 0.0 | 0.0 | 0.5 | 0.3 | .836 |
| Percutaneous transluminal coronary angioplasty in the episode | 2.4 | 0.0 | 3.7 | 5.4 | .155 |
| Previous CABG in the episode | 3.5 | 8.0 | 9.1 | 7.9 | .311 |
| Cancer, metastatic cancer, and acute leukemia (CC8_14) | 3.5 | 4.0 | 3.2 | 5.0 | .293 |
| Protein-calorie malnutrition (CC21) | 0.0 | 0.0 | 0.5 | 0.3 | .836 |
| Morbid obesity: other endocrine/metabolic/nutritional disorders (CC22_25_26) | 50.6 | 64.0 | 55.1 | 48.1 | .011 |
| Vascular or circulatory disease (CC27_32) | 5.9 | 0.0 | 3.1 | 5.1 | .103 |
| Other gastrointestinal disorders (CC38) | 16.5 | 8.0 | 10.6 | 11.3 | .404 |
| Dementia or other specific cerebral disorders (CC51_53) | 1.2 | 0.0 | 1.4 | 2.4 | .307 |
| Hemiparesis, paraplegia, paralysis, functional disability (CC70_74_103_104_189_190) | 0.0 | 0.0 | 1.2 | 2.0 | .27 |
| Congestive heart failure (CC85) | 43.5 | 44.0 | 28.8 | 32.0 | .014 |
| Acute myocardial infarction (CC86) | 1.2 | 0.0 | 0.7 | 0.9 | .878 |
| Unstable angina and other acute ischemic heart diseases (CC87) | 0.0 | 0.0 | 0.9 | 0.6 | .634 |
| Angina; acute myocardial infarction (CC88) | 3.5 | 12.0 | 2.4 | 2.7 | .036 |
| Hypertension (CC95) | 43.5 | 56.0 | 58.6 | 51.9 | .005 |
| Stroke (CC99_100) | 2.4 | 0.0 | 1.3 | 0.8 | .492 |
| Vascular or circulatory disease (CC106_109) | 17.6 | 28.0 | 18.6 | 21.6 | .267 |
| Chronic obstructive pulmonary disease (CC111) | 9.4 | 24.0 | 13.4 | 12.7 | .277 |
| Pneumonia (CC114_116) | 1.2 | 0.0 | 1.2 | 2.3 | .259 |
| Kidney dialysis (CC134) | 2.4 | 0.0 | 0.3 | 0.8 | .139 |
| Kidney damage (CC135_140) | 36.5 | 24.0 | 23.9 | 27.8 | .04 |
| Pressure ulcers or chronic skin ulcer (CC157_160) | 1.2 | 4.0 | 0.5 | 0.3 | .031 |
| Chronic skin ulcer except for pressure ulcers (CC161) | 0.0 | 0.0 | 0.6 | 0.0 | .078 |
| Diabetes mellitus or diabetic complications except for proliferative retinopathy (CC17_19_123) | 34.1 | 32.0 | 34.7 | 32.9 | .868 |
|
CABG, coronary artery bypass graft; CC, Condition Categories;25 CICU, cardiac surgery and intensive care unit. Note: 16 episodes could not be identified into any of the 4 groups of hospitals. Data are expressed as no. (%) or mean ± standard deviation. |
|||||
Hospital structural variables
To analyze the possible correlation between the hospital structural variables and the results of aortic valve implantation both the volume of procedures performed and the cardiovascular resources available were studied. Hospitals were classified based on the availability of cardiology related resources and according to the RECALCAR criteria21 (table 2 of the supplementary data). Regarding this study, to analyze the inter-hospital differences, only those with cath lab capabilities without (type 3) and with cardiac surgery (type 4) were included. The availability of CICU based on a survey previously conducted by the Spanish Society of Cardiology was also included.22 The characteristics to consider the presence of a CICU were: a) a comprehensive capacity to manage patients in critical condition including invasive mechanical ventilation, and b) the administrative adhesion of the CICU to the cardiology unit.
Table 2. Differences in the profile of patients and in the results of surgical aortic valve replacement based on the structural characteristics of each center (2014-2015)
| Hospitales tipo 4 | |||||
|---|---|---|---|---|---|
| Non-CICU | CICU | P | |||
| Number of episodes | 6456 | 7523 | |||
| Age | 69.3 ± 11.2 | 69.6 ± 11.3 | .053 | ||
| Sex | 41.7 | 41.8 | .823 | ||
| Charlson index | 6.5 ± 1.8 | 6.5 ± 1.9 | .885 | ||
| Cardiogenic shock | 2.0 | 1.3 | .001 | ||
| Previous percutaneous transluminal coronary angioplasty | 4.9 | 3.9 | .004 | ||
| Infectious endocarditis | 1.5 | 1.4 | .507 | ||
| CABG in the episode | 18.9 | 18.9 | .894 | ||
| Percutaneous transluminal coronary angioplasty in the episode | 0.5 | 0.8 | .116 | ||
| Previous CABG in the episode | 2.4 | 3.5 | < .001 | ||
| Cancer, metastatic cancer, and acute leukemia (CC8_14) | 2.0 | 2.6 | .023 | ||
| Protein-calorie malnutrition (CC21) | 0.6 | 0.2 | < .001 | ||
| Morbid obesity: other endocrine/metabolic/nutritional disorders (CC22_25_26) | 49.7 | 49.5 | .789 | ||
| Vascular or circulatory disease (CC27_32) | 4.1 | 3.7 | .209 | ||
| Other gastrointestinal disorders (CC38) | 7.0 | 8.2 | .006 | ||
| Dementia or other specific cerebral disorders (CC51_53) | 0.8 | 0.8 | .666 | ||
| Hemiparesis, paraplegia, paralysis, functional disability (CC70_74_103_104_189_190) | 1.7 | 1.7 | .737 | ||
| Congestive heart failure (CC85) | 19.2 | 24.1 | < .001 | ||
| Acute myocardial infarction (CC86) | 1.4 | 1.4 | .670 | ||
| Unstable angina and other acute ischemic heart diseases (CC87) | 1.7 | 1.6 | .528 | ||
| Angina; acute myocardial infarction (CC88) | 1.2 | 1.4 | .242 | ||
| Hypertension (CC95) | 55.6 | 53.5 | .015 | ||
| Stroke (CC99_100) | 1.7 | 2.0 | .140 | ||
| Vascular or circulatory disease (CC106_109) | 19.7 | 21.1 | .034 | ||
| Chronic obstructive pulmonary disease (CC111) | 7.7 | 7.7 | .893 | ||
| Pneumonia (CC114_116) | 1.9 | 2.1 | .309 | ||
| Kidney dialysis (CC134) | 0.3 | 0.4 | .857 | ||
| Kidney damage (CC135_140) | 18.9 | 18.5 | .576 | ||
| Pressure ulcers or chronic skin ulcer (CC157_160) | 0.8 | 0.5 | .058 | ||
| Chronic skin ulcer except for pressure ulcers (CC161) | 0.2 | 0.2 | .707 | ||
| Diabetes mellitus or diabetic complications except for proliferative retinopathy (CC17_19_123) | 25.3 | 23.3 | .007 | ||
|
CABG, coronary artery bypass graft; CC, Condition Categories;25 CICU, cardiac surgery and intensive care unit. Note: 1167 episodes could not be identified in any of the 2 groups of hospitals. Data are expressed as no. (%) or mean ± standard deviation. Only statistically significant factors with OR > 1 are shown. |
|||||
Statistical analysis
The risk adjustment models were specified based on the Centers for Medicare and Medicaid Services (CMS) methodology. Regarding CABG, the variables included in the 30-day mortality model were considered as independent variables.23 Also, certain variables anticipated by the Society of Thoracic Surgeons score for aortic valve replacement—and that can be identified in the MBD24—were included too. Finally, the CMS model was adjusted to the data structure of the MBD after gathering secondary diagnoses based on clinical categories.25 The multilevel logistics regression models were also adjusted.26,27 Only statistically significant comorbidities and odds ratio (OR) > 1.0 were considered for the adjustment model.
Based on specified models the risk-adjusted standardized mortality ratio (RA-SMR) was estimated.28 To adjust the length of the hospital stay, the Poisson regression model was used including the year of hospital discharge, the sex of the patient, and the degree of severity of groups related by refined diagnosis as risk factors. The expected length of the hospital stay was obtained from the individual predictions of the adjusted model. Also, the risk-adjusted length of stay ratio (RA-LOSR) was estimated as the coefficient between the length of the stay observed and the length of the stay expected.
To distinguish between high and low-volume hospitals (based on the number of episodes treated), a group clustering algorithm was used. To that end, the mathematical model used was developed with two thirds of the database and validated with the remaining third. The algorithm ranked as high-volume centers for TAVI those that performed ≥ 46 procedures, and as high-volume centers for SAVR those that performed ≥ 240 procedures during the study 2 year-period (2014-2015).
Quantitative variables were expressed as means ± standard deviations and the qualitative ones as frequencies and percentages. The correlation among the quantitative variables was analyzed using Pearson correlation coefficient. For comparison purposes, the Student t test for 2 samples and the analysis of variance (ANOVA) were used with correction of the level of significance using the Bonferroni method for ≥ 3 groups. Comparisons among the different categorical variables were conducted using the chi-square test or Fisher’s exact test.
All comparisons were bilateral, and differences were considered statistically significant with P values < .05. Statistical analyses were conducted using the STATA 13 and SPSS v21.0 software package.
RESULTS
A total of 2055 TAVIs and 15146 SAVRs were performed. Back in 2014 a total of 812 TAVIs were performed in 47 centers and in 2015 the number went up to 1243 in 53 centers.
The differences seen in the profile of the patients who underwent TAVI and SAVR are shown on table 1 and table 2, respectively, based on the type of hospital where procedures were performed. No statistically significant differences regarding age and sex were seen in patients who underwent TAVI in any of the 4 groups. Still, comorbidity was significantly higher (higher Charlson index and higher incidence of heart failure) in patients treated in type 3 non-CICU hospitals.
Regarding patients who underwent SAVR, by definition in type 4 hospitals, no statistically significant differences were seen regarding age, sex or presence of comorbidities among patients treated with and without CICU except for a higher prevalence of cardiogenic shock and previous percutaneous coronary interventions in non-CICU hospitals (2.0% vs 1.3%, P < .001; and 4.9% vs 3.9%, P = .004, respectively) (table 2).
The in-hospital mortality adjustment model for surgical aortic valve replacement showed good discrimination capabilities (area under the ROC curve, 0.84; 95% confidence interval [95%CI], 0.82-0.85) and calibration (P < .001). The model median odds ratio was 1.73, indicative of a high inter-hospital variability.
The SAVR specific in-hospital mortality adjustment model also showed excellent discrimination and calibration capabilities too (area under the ROC curve, 0.84; 95%CI, 0.83-0.84; calibration, P < .001) that were slightly lower for the TAVI specific adjustment model (area under the ROC curve, 0.79; 95%CI, 0.74-0.84; calibration, P < .001).
Characteristics of the treating center and TAVI results
Type 4 hospitals had a significantly lower RA-SMR compared to type 3 hospitals (4.04 ± 0.98 vs 4.47 ± 0.79). No statistically significant differences were seen on the RA-LOSR (0.99 ± 0.81 vs 1.07 ± 0.81; P = .278). The presence of a CICU was associated with a slightly lower, but sill statistically significant, RA-SMR (4.03 ± 0.87 vs 4.1 ± 1.07; P < .001). The correlation between CICU and a lower RA-SMR was also found in type 4 (4.03 ± 0.88 vs 4.05 ± 1.08; P < .001) and type 3 hospitals (4.09 ± 0.06 vs 4.59 ± 0.87; P < .001) (table 3).
Table 3. Differences in the results of transcatheter aortic valve implantation based on the characteristics each center (2014-2015)
| Type 3 hospitals | Type 4 hospitals | P | |||
|---|---|---|---|---|---|
| Non-CICU | CICU | Non-CICU | CICU | ||
| Acute myocardial infarction | 1.2 | 0.0 | 0.7 | 0.9 | .878 |
| Implantation of permanent pacemaker | 17.6 | 16.0 | 13.2 | 15.0 | .536 |
| Postoperative stroke | 1.2 | 0.0 | 1.0 | 0.6 | .624 |
| Prosthetic heart valve complications | 3.53 | 0.00 | 1.85 | 4.32 | .002 |
| Postoperative shock | 0.00 | 0.00 | 0.58 | 1.79 | .017 |
| Postoperative kidney damage | 1.2 | 0.0 | 2.5 | 2.4 | .743 |
| Hemorrhage or hematoma complicating the procedure | 16.5 | 32.0 | 10.5 | 13.7 | .003 |
| Accidental puncture or laceration during the procedure | 3.5 | 0.0 | 3.2 | 4.0 | .600 |
| Postoperative infection | 1.2 | 0.0 | 0.6 | 1.7 | .145 |
| Sepsis | 0.0 | 0.0 | 0.8 | 0.8 | .819 |
| Vascular surgery during admission | 2.4 | 4.0 | 5.0 | 5.7 | .542 |
| RA-LOSR | 1.10 ± 0.87 | 0.97 ± 0.47 | 0.98 ± 0.77 | 1.00 ± 0.85 | .581 |
| RA-SMR | 4.59 ± 0.87 | 4.09 ± 0.06 | 4.05 ± 1.08 | 4.03 ± 0.88 | < .001 |
|
CICU, cardiac surgery and intensive care unit; RA-LOSR, risk-adjusted length of stay ratio; RA-SMR, risk-adjusted standardized mortality ratio. Data are expressed as no. (%) or mean ± standard deviation. |
|||||
CICU capable type 4 hospitals had a higher incidence of postoperative shock (1.8% vs 0.6%; P = .017), the same incidence of sepsis (0.8% vs 0.8%; P < .819), and a lower RA-SMR (4.03 ± 0.88 vs 4.05 ± 1.08; P < .001) compared to non-CICU hospitals.
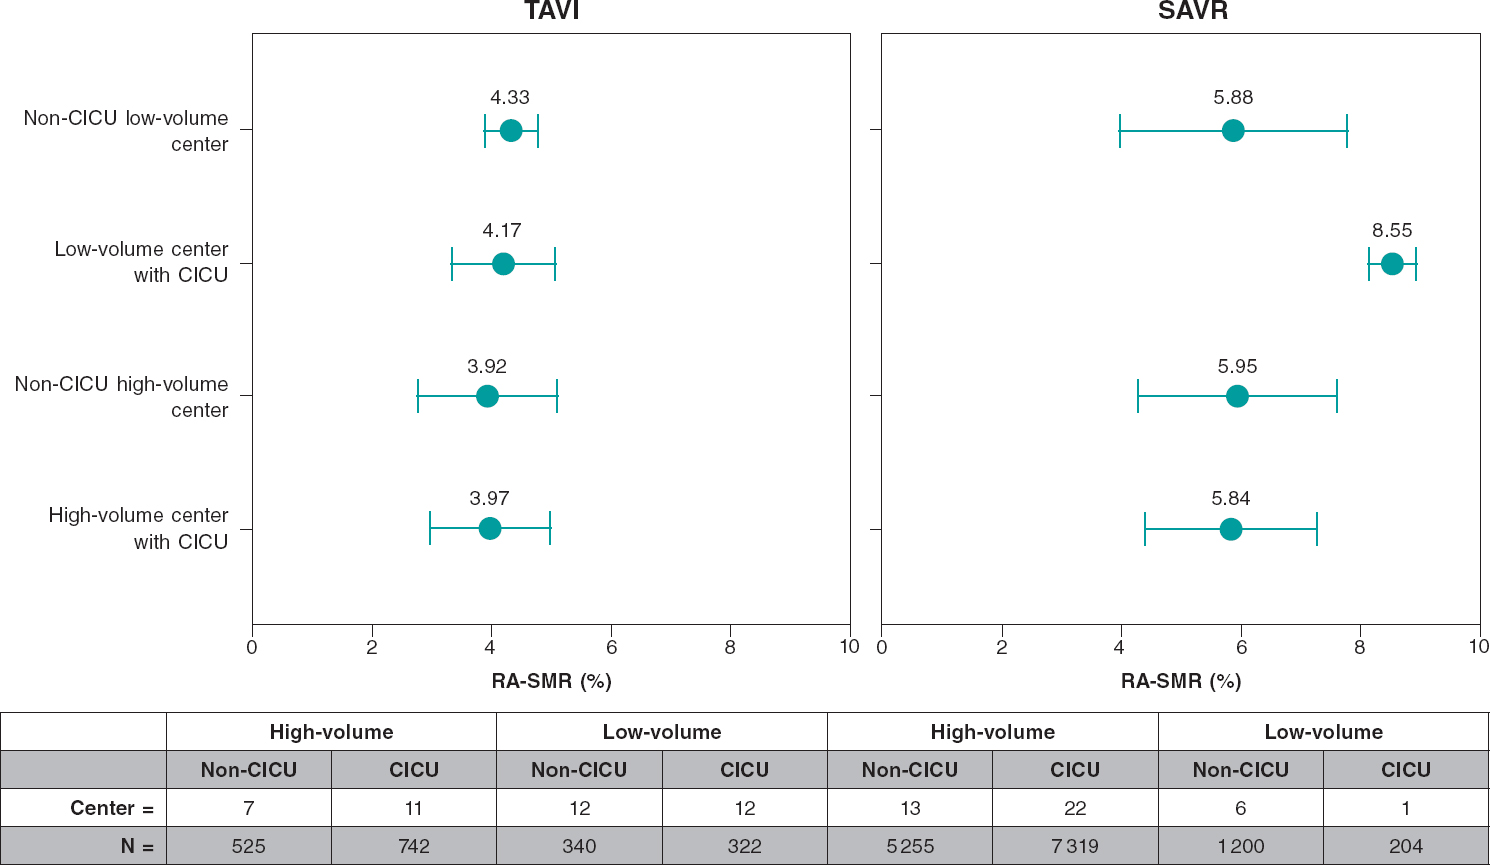
Regarding the volume of procedures performed by the hospitals, the median of TAVI per year was 11 [2-36 for low-volume centers and 33 [9-67] for high-volume hospitals. The RA-SMR was lower in high-volume hospitals (3.95 ± 1.08 vs 4.26 ± 0.72; P < .001) (table 4 and figure 1). The mean adjusted stay did not show any differences between CICU capable and non-CICU hospitals (1.00 ± 0.85 vs 0.98 ± 0.77; P = .581). In general, regarding the crude complication rates, TAVI did not show any statistically significant differences between high and low-volume hospitals (table 4).
Table 4. Differences in the results of transcatheter aortic valve implantation based on the volume of cases of each center (2014-2015)
| Low-volume centers | High-volume centers | P | |
|---|---|---|---|
| Acute myocardial infarction | 0.63 | 0.95 | .311 |
| Implantation of permanent pacemaker | 14.21 | 14.36 | .489 |
| Postoperative stroke | 0.91 | 0.71 | .402 |
| Prosthetic heart valve complications | 2.92 | 4.86 | .366 |
| Postoperative shock | 1.46 | 1.33 | .172 |
| Postoperative kidney damage | 2.54 | 2.29 | .412 |
| Hemorrhage or hematoma complicating the procedure | 13.60 | 12.15 | .188 |
| Accidental puncture or laceration during the procedure | 2.72 | 4.18 | .054 |
| Postoperative infection | 1.30 | 1.10 | .424 |
| Sepsis | 1.17 | 0.55 | .105 |
| Vascular surgery during admission | 4.15 | 5.92 | .049 |
| RA-LOSR | 0.992 ± 0.655 | 1.008 ± 0.787 | .237 |
| RA-SMR | 4.26 ± 0.72 | 3.95 ± 1.08 | < .001 |
|
RA-LOSR, risk-adjusted length of stay ratio; RA-SMR, risk-adjusted standardized mortality ratio. Data are expressed as no. (%) or mean ± standard deviation. |
|||
Figure 1. In-hospital mortality adjusted comparison for transcatheter aortic valve implantation (TAVI) and surgical aortic valve replacement (SAVR). Note that, regarding SAVR, in low-volume centers with CICU only 1 center was excluded. CICU, cardiac surgery and intensive care unit; RA-LOSR, risk-adjusted length of stay ratio; RA-SMR, risk-adjusted standardized mortality ratio.
Characteristics of the treating center and SAVR results
The presence of a CICU turned out to be a protective factor for in-hospital mortality in these patients (OR, 0.79; 95%CI, 0.67-0.93; P = .005). However, the different RA-SMRs seen among various centers with and without CICU capabilities did not show statistically significant differences (5.91 ± 1.49 with CICU vs 5.94 ± 1.72 without it; P = .335) (figure 1). The same thing happened with the RA-LOSR. CICU capable type 4 hospitals had a higher incidence of postoperative shock (2.2% vs 1.3%; P = .024) but a lower incidence of sepsis (1.1% vs 2.3%; P < .001) (table 5).
Table 5. Differences in the results of surgical aortic valve replacement based on the characteristics of each center (2014-2015)
| Type 4 hospitals | P | ||
|---|---|---|---|
| Non-CICU | CICU | ||
| Acute myocardial infarction | 1.4 | 1.4 | .67 |
| Implantation of permanent pacemaker | 4.0 | 4.5 | .138 |
| Postoperative stroke | 1.1 | 1.3 | .305 |
| Prosthetic heart valve complications | 2.5 | 1.1 | .729 |
| Postoperative shock | 1.3 | 2.2 | .024 |
| Postoperative kidney damage | 6.9 | 6.1 | .038 |
| Hemorrhage or hematoma complicating the procedure | 6.2 | 6.3 | .767 |
| Accidental puncture or laceration during the procedure | 1.0 | 0.8 | .095 |
| Postoperative infection | 1.8 | 2.2 | .132 |
| Sepsis | 2.3 | 1.1 | < .001 |
| Vascular surgery during admission | 2.7 | 3.1 | .166 |
| RA-LOSR | 1.00 ± 0.68 | 0.99 ± 0.67 | .770 |
| RA-SMR | 5.91 ± 1.49 | 5.94 ± 1.72 | .335 |
|
CICU, cardiac surgery and intensive care unit; RA-LOSR, risk-adjusted length of stay ratio; RA-SMR, risk-adjusted standardized mortality ratio. Data are expressed as no. (%) or mean ± standard deviation. |
|||
In relation to the volume of procedures performed, the RA-SMR was lower in high-volume hospitals (5.89 ± 1.54 vs 6.27 ± 2.02; P < .001) (table 6) without any statistically significant differences with respect to the RA-LOSR (0.99 ± 0.73 vs 1.06 ± 0.75; P = .463). No statistically significant differences were seen between high and low-volume hospitals in the crude complication rates (table 6).
Table 6. Differences in the results of surgical aortic valve replacement based on the volume of cases of each center (2014-2015)
| Low-volume centers | High-volume centers | P | |
|---|---|---|---|
| Acute myocardial infarction | 1.81 | 1.37 | .066 |
| Implantation of permanent pacemaker | 3.75 | 4.32 | .117 |
| Postoperative stroke | 0.93 | 1.22 | .117 |
| Prosthetic heart valve complications | 1.54 | 1.14 | .072 |
| Postoperative shock | 2.26 | 2.44 | .320 |
| Postoperative kidney damage | 6.63 | 6.67 | .462 |
| Hemorrhage or hematoma complicating the procedure | 5.95 | 6.35 | .279 |
| Accidental puncture or laceration during the procedure | 0.82 | 0.88 | .445 |
| Postoperative infection | 1.57 | 2.04 | .112 |
| Sepsis | 1.46 | 1.69 | .269 |
| Vascular surgery during admission | 2.22 | 2.93 | .055 |
| RA-LOSR | 1.06 ± 0.75 | 0.99 ± 0.73 | .463 |
| RA-SMR | 6.27 ± 2.02 | 5.89 ± 1.54 | < .001 |
|
CICU, cardiac surgery and intensive care unit; RA-LOSR, risk-adjusted length of stay ratio; RA-SMR, risk-adjusted standardized mortality ratio. Data are expressed as no. (%) or mean ± standard deviation. |
|||
Association between TAVI and SAVR results
In type 4 hospitals, no statistically significant linear correlations were found between the RA-SMRs of TAVI and those of SAVR (r = 0.21; P = .14). Similarly, the SAVR high-volume variable had a non-statistically significant protective effect when it was introduced in the risk-adjustment model of TAVI related in-hospital mortality (OR, 0.73; 95%CI, 0.33-1.62). The 17 hospitals (1134 episodes identified) that shared the TAVI and SAVR high-volume feature had a TAVI related RA-SMR that was significantly lower compared to centers with the TAVI and SAVR low-volume feature (4 ± 1.1 vs 4.5 ± 0.7; P < .001). A single center (80 episodes) with a high-volume of TAVI and a low-volume of SAVR had the lowest TAVI related RA-SMR of all (2.8 ± 0.3; P < .001 with respect to a high-volume of TAVI and SAVR performed).
DISCUSSION
This study findings that included real-world data in our country, show a consistent correlation between the hospital structural characteristics and the results obtained in aortic valve replacement procedures, both surgical and transcatheter (figure 1). High-volume hospitals with cardiac surgery and intensive care units (CICU) have lower risk-adjusted mortality rates in both procedures.
In relation to the association between volume and results, our study also shows TAVI results that are consistent to those described by the medical literature,10-14 with mortality rates that are similar to those seen in other countries in the study period (2014-2015) and higher to those published for 2015-2017.14 In Spain, the mortality rate differences seen after adjusting for high and low-volume centers are lower to the ones reported, which may be explained because, actually in those years in Spain, low-volume centers were being compared to very low-volume centers. Therefore, 52 out of the 53 center that performed TAVIs in Spain from 2014 through 2015 were within the range of the 2 lower quartiles (5-54 procedures per year), per volume of procedures performed, in the study conducted by Vemulapalli et al.14. Only 7 of those centers were above the range of the lower tercile in the study conducted by Kaier et al.15.
These data should be interpreted in the context of the learning curve of this technique in our country.29
The correlation between a higher volume and a lower RA-SMR was also found for SAVR. Again in this case, low-volume centers were being compared since only 12 and 10 out of the 42 centers, in 2014 and 2015 respectively, performed > 200 SAVRs, and over 70% of the centers were within the 2 lower quartiles of SAVR volume according to the study conducted by Hirji et al.30.
In this study, TAVI and SAVR high-volume centers had a lower TAVI-adjusted mortality rate compared to low-volume centers for both procedures, which is consistent with the findings reported by Mao et al.31. However, the only hospital identified as a high-volume center for TAVI and a low-volume center for SAVR had excellent TAVI results; since it was a single center with limited number of cases (4% of all TAVIs performed), this finding, suggestive that specific experience is more relevant than global experience in aortic valve replacement procedures, should be studied in the future. However, this is reasonable because it shows that here experience accumulates per processes or specific dedicated teams rather than centers in general.
Since no references were found in the medical literature, the newest finding of this study was the association between the presence of a CICU and the lower mortality rate reported for both techniques. This correlation is even more solid and clinically significant for TAVI rather than SAVR, which seems somehow intuitive, since patients treated with SAVR are often referred to general intensive care units.
The association between CICU availability and optimal results in the management of cardiogenic shock in the AMI setting20 had been described by the Spanish National Healthcare System. However, this association had not been reported in surgical procedures. Medical literature describes a virtuous relation between the volume of SAVRs performed and TAVI results, which is probably associated with the greater experience of the heart team.29,31 The presence of a CICU can be a variable that includes both the cardiologists’ greater experience and higher participation in the management of patients in critical cardiac condition and the experience of the hospital, cardiology unit, and cardiac surgery unit. In both cases, the CICU contributes to a better management of patients treated with interventional procedures (TAVI and SAVR) across the entire healthcare process.
Therefore, the results described may me important to plan healthcare and allocate resources such as teaching and training in the 2 aforementioned procedures.
Limitations
This study is a retrospective analysis of administrative data. However, even with its inherent limitations, the validity of its design has been compared to clinical registries.26,32 Such reliability allows us to compare the results of multiple hospitals33 and has been used specifically to analyze TAVI results.11-13,29,30 However, we should mention that data from the MBD should be interpreted with caution because they were not audited. Finally, this study shows the early experience with TAVI, probably still within the learning curve of this technique in the centers studied, which is why findings should be compared to more recent and larger series.
CONCLUSIONS
There is a correlation between the structural characteristics of the treating centers and the results obtained in aortic valve replacement, both surgical and endovascular, with great heterogeneity among the various centers. Large volume hospitals with cardiac surgery units and CICU capabilities have a lower risk-adjusted mortality rate in both procedures.
FUNDING
This study has been funded by an unconditional grant from the Interhospital Foundation for Cardiovascular Research.
AUTHORS' CONTRIBUTIONS
I. J. Núñez-Gil: conceptualization, drafting of the manuscript and analysis; J. Elola and M. García-Márquez: conceptualization, data collection and analysis, drafting and critical review of the manuscript; J. L. Bernal and C. Fernández: data collection and analysis and critical review of the manuscript; A. Íñiguez, L. Nombela Franco, P. Jiménez-Quevedo, J. Escaned and C. Macaya: elaboration and critical review of the manuscript; and A. Fernández-Ortiz: conceptualization, data analysis, preparation and critical review of the manuscript.
CONFLICTS OF INTEREST
None reported.
ACKNOWLEDGEMENTS
We wish to thank the Health Information Institute of the Spanish National Healthcare System at the Spanish Ministry of Health, Consumer Affairs and Social Welfare for partially disclosing the MBD database.
WHAT IS KNOWN ABOUT THE TOPIC?
- Symptomatic severe aortic stenosis is a common cause of morbidity and mortality in our country. The treatment recommended here is aortic valve replacement.
- In numerous medical and surgical procedures, the volume of procedures performed by the treating hospital has proven to play a significant role in the results obtained.
- This correlation between volume and results has been specifically reported for TAVI. In Spain, it has been reported for AMI, cardiogenic shock, and coronary revascularization surgery, among others.
WHAT DOES THIS STUDY ADD?
- This article analyses real-world data in our country from over 17000 patients who received a prosthetic aortic valve through SAVR or TAVI.
- The findings show an important heterogeneity and a consistent correlation between the structural character-istics of the treating centers and the results obtained in aortic valve replacement both through SAVR and TAVI.
- Large-volume centers with cardiac surgery units and CICU capabilities run by cardiologists have lower risk-adjusted mortality rates in both procedures.
REFERENCES
1. Alkhouli M, Alqahtani F, Ziada KM, Aljohani S, Holmes DR, Mathew V. Contemporary trends in the management of aortic stenosis in the USA. Eur Heart J. 2020;41:921-928.
2. Baumgartner H, Falk V, Bax JJ, et al. 2017 ESC/EACTS Guidelines for the management of valvular heart disease. Eur Heart J. 2017;38:2739-2791.
3. Luft HS, Hunt SS. Evaluating individual hospital quality through outcome statistics. JAMA. 1986;255:2780-2784.
4. Thiemann DR, Coresh J, Oetgen WJ, Powe NR. The association between hospital volume and survival after acute myocardial infarction in elderly patients. N Engl J Med. 1999;340:1640-1648.
5. Birkmeyer JD, Siewers AE, Finlayson EV, et al. Hospital volume and surgical mortality in the United States. N Engl J Med. 2002;346:1128-1137.
6. Gandjour A, Bannenberg A, Lauterbach KW. Threshold volumes associated with higher survival in health care:a systematic review. Med Care. 2003;41:1129-1141.
7. Ross JS, Normand ST, Wang Y, et al. Hospital Volume and 30-Day Mortality for Three Common Medical Conditions. N Engl J Med. 2010;362:1110-1118.
8. Luft HS, Bunker JP, Enthoven AC. Should operations be regionalized?The empirical relation between surgical volume and mortality. N Engl J Med. 1979;301:1364-1369.
9. Canto JG, Every NR, Magid DJ, et al. The volume of primary angioplasty procedures and survival after acute myocardial infarction. N Engl J Med. 2000;342:1573-1580.
10. Vakili BA, Kaplan R, Brown DL. Volume-Outcome Relation for Physicians and Hospitals Performing Angioplasty for Acute Myocardial Infarction in New York State. Circulation. 2001;104:2171-2176.
11. Srinivas VS, Hailpern SM, Koss E, Monrad ES, Alderman MH. Effect of Physician Volume on the Relationship Between Hospital Volume and Mortality During Primary Angioplasty. J Am Coll Cardiol. 2009;53:574-579.
12. Kim LK, Minutello RM, Feldman DN, et al. Association between transcath eter aortic valve implantation volume and outcomes in the United States. Am J Cardiol. 2015;116:1910-1915.
13. Badheka AO, Patel NJ, Panaich SS, et al. Effect of hospital volume on outcomes of transcatheter aortic valve implantation. Am J Cardiol. 2015;116:587-594.
14. Vemulapalli S, Carroll JD, Mack MJ, et al. Procedural Volume and Outcomes for Transcatheter Aortic-Valve Replacement. N Engl J Med. 2019;380:2541-2550.
15. Kaier K, Oettinger V, Reinecke H, et al. Volume–outcome relationship in transcatheter aortic valve implantations in Germany 2008–2014:a secondary data analysis of electronic health records. BMJ Open. 2018;8:e020204.
16. Goicolea Ruigómez FJ, Elola J, Durante-López A, Fernández-Pérez C, Bernal JL, Macaya C. Cirugía de revascularización aortocoronaria en España. Influencia del volumen de procedimientos en los resultados. Rev Esp Cardiol. 2020;73:488-494.
17. Bertomeu V, Cequier A, Bernal JL, et al. Mortalidad intrahospitalaria por infarto agudo de miocardio. Relevancia del tipo de hospital y la atención dispensada. Estudio RECALCAR. Rev Esp Cardiol. 2013;66:935-942.
18. Worner F, San Román A, Sánchez PL, Viana A, González-Juanatey JR. Atención a los pacientes con enfermedades cardiacas agudas y críticas. Posición de la Sociedad Española de Cardiología. Rev Esp Cardiol. 2015;69:239-242.
19. Rodriguez-Padial L, Elola FJ, Fernández-Pérez C, et al. Patterns of inpatient care for acute myocardial infarction and 30-day, 3-month and 1-year cardiac readmission rates in Spain. Int J Cardiol. 2017;230:14-20.
20. Sánchez-Salado JC, Burgos V, Ariza-SoléA, et al. Trends in cardiogenic shock management and prognostic impact of type of treating center. Rev Esp Cardiol. 2020;73:546-553.
21. Íñiguez Romo A, Bertomeu Martínez V, Rodríguez Padial L, et al. The RECALCAR project. Healthcare in the cardiology units of the Spanish National Health System, 2011 to 2014. Rev Esp Cardiol. 2017;70:567-575.
22. Worner F, San Román A, Sánchez PL, Viana Tejedor A, González-Juanatey JR. The healthcare of patients with acute and critical heart disease. Position of the Spanish Society of Cardiology. Rev Esp Cardiol. 2016;69:239-242.
23. Procedure-Specific Measure Updates and Specifications Report Hospital-Level 30-Day Risk-Standardized Mortality Measure Isolated Coronary Artery Bypass Graft (CABG) Surgery –Version 4.0. Yale New Haven Health Services Corporation/Center for Outcomes Research & Evaluation (YNHHSC/CORE). Centers for Medicare & Medicaid Services (CMS). 2017.
24. Society of Thoracic Surgeons'. Online STS Adult Cardiac Surgery Risk Calculator. Available online:http://riskcalc.sts.org/stswebriskcalc/#/. Consultado 20 Dic 2019.
25. Pope GC, Ellis RP, Ash AS, et al. Principal inpatient diagnostic cost group model for Medicare risk adjustment. Health Care Financ Rev. 2000;21:93-118.
26. Sharon-Lise T, Normand SLT, Glickman ME, Gatsonis CA. Statistical methods for profiling providers of medical care:issues and applications. J Am Stat Assoc. 1997;92:803-814.
27. Goldstein H, Spiegelhalter DJ. League tables and their limitations:statistical aspects of institutional performance. J Royal Stat Soc. 1996;159:385-443.
28. Shahian DM, Normand SL, Torchiana DF, et al. Cardiac surgery report cards:comprehensive review and statistical critique. Ann Thorac Surg. 2001;72:2155-2168.
29. Lunardi M, Pesarini G, Zivelonghi C, et al. Clinical outcomes of transcatheter aortic valve implantation:from learning curve to proficiency. Open Heart. 2016;3:e000420.
30. Hirji SA, McCarthy E, Kim D, et al. Relationship Between Hospital Surgical Aortic Valve Replacement Volume and Transcatheter Aortic Valve Replacement Outcomes. JACC Cardiovasc Interv. 2020;13:335-343.
31. Mao J, Redberg RF, Carroll JD, et al. Association Between Hospital Surgical Aortic Valve Replacement Volume and Transcatheter Aortic Valve Replacement Outcomes. JAMA Cardiol. 2018;3:1070-1078.
32. Bernal JL, Barrabés JA, Íñiguez A, et al. Clinical and administrative data on the research of acute coronary syndrome in Spain:minimum basic data set validity. Rev Esp Cardiol. 2018;72:56-62.
33. Krumholz HM, Wang Y, Mattera JA, et al. An administrative claims model suitable for profiling hospital performance based on 30 day mortality rates among patients with an acute myocardial infarction. Circulation. 2006;113:1683-1692.


