

Article
Ischemic heart disease and acute cardiac care
REC Interv Cardiol. 2019;1:21-25
Access to side branches with a sharply angulated origin: usefulness of a specific wire for chronic occlusions
Acceso a ramas laterales con origen muy angulado: utilidad de una guía específica de oclusión crónica
Servicio de Cardiología, Hospital de Cabueñes, Gijón, Asturias, España
ABSTRACT
Introduction and objectives: Assessment and treatment of intermediate coronary lesions, defined as those which represent 30%-90% of the vessel lumen, remains a clinical challenge. Physiological evaluation techniques, such as fractional flow reserve (FFR), non-adenosine-based methods, such as instantaneous wave-free ratio or resting full-cycle ratio, and angiography-derived physiological assessment techniques (ADPAT) have transformed the diagnostic landscape. This meta-analysis aimed to systematically review and compare the diagnostic performance of ADPAT and FFR evaluating intermediate coronary lesions.
Methods: We conducted a systematic review of comparative research on FFR and ADPAT from January through February 2024.
Results: A total of 27 studies were finally included in the meta-analysis for a total of 4818 patients and 5440 vessels. Overall, a strong correlation between the different ADPAT and FFR was observed (r = 0.83; 95%CI, 0.80-0.85), with a mean ADPAT value of 0.82; 95%CI, 0.81-0.83 and a mean FFR of 0.83; 95%CI, 0.82-0.85. The summary area under the curve for predicting significant FFR (≤ 0.80) was excellent at 0.947. The overall sensitivity rate was 85% (95%CI, 81-87) with a specificity rate of 93% (95%CI, 91-94). The positive predictive value was 86% (95%CI, 83-88) with a total negative predictive value of 92% (95%CI, 91-94).
Conclusions: ADPAT show good correlation and concordance with FFR for intermediate coronary lesion evaluation. However, due to unfavorable outcomes observed in the FAVOR III Europe trial1 with quantitative flow ratio-guided revascularization, its clinical role should be reconsidered and potentially limited to scenarios where invasive assessment or adenosine use is not feasible. Further evaluation is warranted to confirm its diagnostic performance in broader clinical contexts.
Registered at PROSPERO: CRD420251042828.
Keywords: Clinical research. Fractional flow reserve. Angiographic/fluoroscopic. Meta-analysis.
RESUMEN
Introducción y objetivos: La evaluación y el tratamiento de las lesiones coronarias intermedias, definidas como aquellas que comprometen entre el 30 y el 90% de la luz del vaso, continúan representando un desafío clínico. Las técnicas de evaluación fisiológica (como la reserva fraccional de flujo [RFF]), los métodos que no requieren adenosina (como el índice instantáneo libre de ondas o el índice de ciclo completo en reposo) y las técnicas de evaluación fisiológica derivadas de la angiografía (ADPAT) han transformado el panorama diagnóstico. Este metanálisis tuvo como objetivo revisar sistemáticamente y comparar el rendimiento diagnóstico de las ADPAT frente a la RFF en la evaluación de lesiones coronarias intermedias.
Métodos: Entre enero y febrero de 2024 se realizó una revisión sistemática de investigaciones comparativas entre RFF y ADPAT.
Resultados: Se incluyeron 27 estudios en el metanálisis, con un total de 4.818 pacientes y 5.440 vasos. En general, se observó una fuerte correlación entre las distintas ADPAT y la RFF (r = 0,83; IC95%, 0,80-0,85), con un valor medio de ADPAT de 0,82 (IC95%, 0,81-0,83) y un valor medio de FFR de 0,83 (IC95%, 0,82-0,85). El área bajo la curva resumen para predecir una RFF significativa (≤ 0,80) fue excelente, con un valor de 0,947. La sensibilidad global fue del 85% (IC95%, 81-87) y la especificidad fue del 93% (IC95%, 91-94). El valor predictivo positivo fue del 86% (IC95%, 83-88) y el valor predictivo negativo total fue del 92% (IC95%, 91-94).
Conclusiones: Las ADPAT muestran una buena correlación y concordancia con la RFF en la evaluación de lesiones coronarias intermedias. Sin embargo, debido a los resultados desfavorables observados en el estudio FAVOR III Europe1 con la revascularización guiada por el índice cuantitativo de flujo, su papel clínico se debe reconsiderar y posiblemente limitar a escenarios en los que no sea factible realizar una evaluación invasiva ni utilizar adenosina. Se requiere una evaluación adicional para confirmar su rendimiento diagnóstico en contextos clínicos más amplios.
Registrado en PROSPERO: CRD420251042828.
Palabras clave: Investigación clínica. Reserva fraccional de flujo. Angiografía/fluoroscopia. Metanálisis.
Abbreviations
ADPAT: angiography-derived physiological assessment techniques. AUC: area under the curve. FFR: fractional flow reserve. QFR: quantitative flow ratio. uFR: Murray law-based quantitative flow reserve.
INTRODUCTION
Assessment and treatment of intermediate coronary lesions (those where percent diameter stenosis accounts for 30%-90% of the vessel lumen) remains a clinical challenge.1 Over the past 10 years this field has undergone significant changes, primarily due to theoretical and technological advances in physiological evaluation techniques.2,3
Prior to the existence of these techniques, the assessment of intermediate lesions was based on the degree of relative narrowing of the vessel lumen vs healthy segments, being this reduction subjectively determined by the operator, without knowledge of its physiological repercussion.2 The development of pressure guidewire methods, along with their validation and proven prognostic significance (particularly in the context of chronic coronary syndrome) from the late 1990s to the early 2000s,4 has led to substantial progress in intermediate lesions evaluation, which has enabled a more accurate classification based on their clinical relevance.5
The initial method developed, and still considered the gold standard, is fractional flow reserve (FFR).5 This technique estimates blood flow across a coronary lesion by measuring pressure differences.6 To make this estimation between pressure and flow, maximal coronary vessel hyperemia, primarily achieved through adenosine infusion, is necessary.6 FFR is defined as significant if flow difference across the lesion is > 20% (FFR ≤ 0.80).6 Beyond merely identifying which lesions benefit from revascularization, FFR has shown improved survival vs revascularization based on relative narrowing assessment. Furthermore, it has allowed lesion exclusion where revascularization is deemed unnecessary, thus reducing stent implantation rates and any potential complications associated with both this procedure and antiplatelet therapy.7
Despite the clear benefits of using intracoronary physiology, the need for invasive pressure guidewires, IV adenosine (with its potential complications), the time required, and even the outright rejection by interventional cardiologist may have led to a lower than expected adoption.8 These limitations triggered the appearance of non-adenosine-based methods, such as the instantaneous wave-free ratio (iFR) or resting full-cycle ratio.9,10 These methods use a specific moment of the cardiac cycle (for example the iFR uses the diastolic wave-free period) where microvascular resistances are minimal, allowing correlation between pressures and flow without the use of adenosine.11,12 However, despite eliminating this limitation, the use of pressure guidewires is still a barrier.8
Simultaneously with the development of these adenosine-free techniques, angiography-derived physiological assessment techniques (ADPAT) emerged, enabling the physiological evaluation of coronary lesions without the need for a guidewire or adenosine. These techniques, initially derived from those used in coronary lesion assessment in computational tomography,13 are based on the computational evaluation of lesions through fluid dynamics in coronary angiography. Since then, multiple options have emerged including QFR, Murray law-based quantitative flow ratio (uFR), vessel fractional flow reserve (vFRR), fractional flow reserve derived from routine coronary angiography (FFRangio) and coronary angiography-derived fractional flow reserve (CaFFR). All of them have been validated and compared with the gold standard FFR in prospective direct comparative studies of diagnostic accuracy.14-20
The aim of this article was to provide a review of the different validation studies of ADPAT vs FFR and offer a meta-analysis on the accuracy of each option, both collectively and individually.
METHODS
Literature search strategy
We conducted a systematic review of comparative research on FFR and ADPAT from January through February 2024. The PubMed database was used to search for articles on concordance, agreement, and diagnostic accuracy. Multiple searches were conducted using the following algorithm: FFR/FFR permuted with each mainly commercialized tool (QFR, uFR, vFRR, FFRangio and CaFFR) while trying to avoid CT and articles developed mainly in acute coronary syndrome through the commands “NOT (CT) NOT (“acute coronary syndrome”)”. Date range was limited from January 2012 through December 2023. PRISMA statement guidelines were followed, and the review was prospectively registered in the International Prospective Register of Systematic Reviews (PROSPERO) with registration No. CRD420251042828.
Eligible criteria
A total of 4580 terms were identified through the entire search process. These terms and their combinations were carefully selected by 2 different operators to refine the search for articles comparing the main ADPAT from the main commercial vs FFR. Articles involving coronary computed tomography angiography and those where comparisons were mainly drawn within the context of acute coronary syndrome were also excluded by the operators. Based on these criteria, an initial pool of studies was established.
A total of 15 studies were subsequently excluded based on prespecified criteria, including those that specified the presence of patients with concurrent or treated aortic stenosis, had more than 25% of patients diagnosed with atrial fibrillation, or involved angiography- derived physiological assessments for coronary lesions conducted within the first 29 days of acute myocardial infarction (either on the culprit lesion or non-culprit lesions).
In cases where the time elapsed from myocardial infarction to angiography-derived evaluation was nonspecific; articles were also excluded if more than 30% of patients had undergone coronary angiography due to acute myocardial infarction.
Furthermore, studies specifying the presence of 10% or more patients with prior surgical revascularization were excluded, as were those where the comparison between angiography-based physiological assessment methods and FFR was conducted on mammary artery grafts, radial artery grafts, or saphenous vein grafts.
After applying the selection criteria, a total of 29 articles were initially chosen for analysis. However, 2 articles (FAST [virtual FFR])21 and Ai et al.22 were subsequently excluded because they did not provide or calculate sensitivity and specificity data from their analyses. Consequently, the final analysis included 27 articles.
Two articles were divided and included as different items in the analysis as they showed 2 different analyzed cohorts on their studies: Smit et al.,23 where QFR was compared with the FFR in 2 cohorts: 1 with diabetes mellitus and the other without the disease; Zuo et al.24 divided patients in 2 cohorts based on whether the vessel was severely calcified or not. The uFR was compared with the FFR in each group. Each cohort was included in our analysis. Finally, the study by Emori et al.25 “Diagnostic accuracy of quantitative flow ratio for assessing myocardial ischemia in prior myocardial infarction,” presented 2 distinct cohorts based on the presence of prior myocardial infarction (≥ 30 days from coronary angiography). Although one cohort depicted an acute coronary syndrome scenario, it fulfilled our inclusion criteria, leading to the inclusion of both cohorts in the final analysis.
Statistical and methodologic analysis
The homogeneity across studies was contrasted using the QH statistic. Regarding the low sensitivity of this test, P < .10 values were considered significant. To overcome this limitation, the I2 statistic was estimated as well, which measures the proportion of the total variation of the studies, explained by the heterogeneity and its 95% confidence interval (95%CI). A random effects model was used for all cases using the pooled method of DerSimonian Laird. If heterogeneity was present, meta-regression analyses were conducted to explore the sources of heterogeneity (figure 1 of the supplementary data). The presence of publication bias was tested using the Deek funnelplot (figure 2 of the supplementary data).

Figure 1. Selected articles flowchart and exclusion criteria. ADPAT, angiography-derived physiological assessment techniques; AMI, acute myocardial infarction.

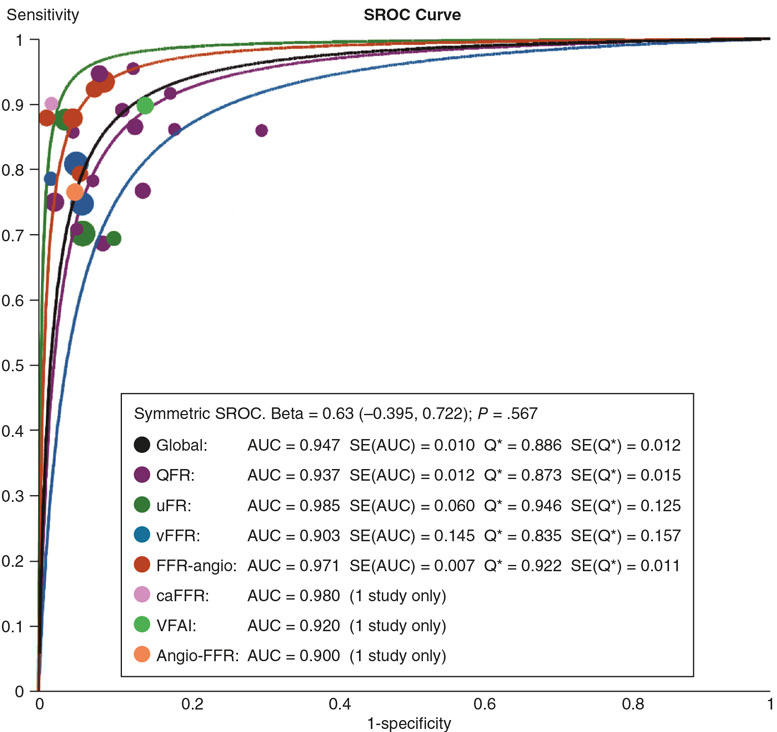
Figure 2. Summary receiver operating characteristic (SROC) curves and Q* index for subgroup analyses of software-derived coronary angiography-derived fractional flow reserve (caFFR); FFR, fractional flow reserve; QFR, quantitative flow ratio; uFR, Murray law-based quantitative flow reserve; VFAI, vessel fractional anatomy index; vFFR, vessel fractional flow reserve.
From the reported values of sensitivity, specificity, negative predictive value, positive predictive value, accuracy, and the number of vessels assessed, all 2 × 2 tables for the 0.8 cutoff point of the tests were constructed. Subsequently, pooled estimates for sensitivity, specificity, positive predictive value, negative predictive value, positive likelihood ratio, and negative likelihood ratio were derived from these data.26
The confidence intervals of sensitivity and specificity were calculated using the F distribution method to compute the exact confidence limits for the binomial proportion (x/n). The summary receive operator curve (SROC) was also calculated from which we drew all the points of sensitivity and 1-specificity and adjusted the weighted regression curve using Moses’ Model. Spearman correlation coefficient between sensitivity and specificity was used to assessed constant diagnostic odds ratio (positive likelihood ratio and negative likelihood ratio) employing a symmetric SROC.27 The area under curve (AUC) was computed by numeric integration of the curve equation using the trapezoidal method. Additionally, we applied the bootstrap methods for estimated AUC of multiple SROC. We provided the resultant bootstrap P values and 95%CI of the AUC for pairwise comparisons of the different methods (table 1 of the supplementary data). Furthermore, we provided an influence diagnostic method based on the AUC by performing leave-one-study-out analyses (table 2 of the supplementary data). Pearson correlation coefficients were transformed into Fisher’s z-values to calculate variance and we performed a meta-analysis and calculated the 95%CI (figure 3 of the supplementary data). Fagan’s Nomogram (figure 4 of the supplementary data) was used to graphically estimate how the result from a diagnostic test altered the probability of a patient having a disease. We assessed applicability and risk of bias based on the modified version of the QUADAS-2 tool28 (figure 5A,B of the supplementary data). All analyses were conducted using R Statistical Software (v4.2.0; R Core Team 2022) and performed using dmetatools R package (1.1.1; Noma H 2023), mada R package (0.5.11; Sousa-Pinto 2022) and TeachingDemos R package (2.13; Greg Snow 2024).
Table 1. Patients’ baseline characteristics
| Patients’ baseline characteristics (n = 4818) | |
|---|---|
| Characteristics (cohorts where this data is available) | (± 95%CI) or % |
| Mean age (26) | 66.4 ± 1.3 |
| Male (26) | 3318 (68.9%) |
| Mean BMI (kg/m2) (17) | 26 ± 0.8 |
| Hypertension (25) | 3189 (66.2%) |
| Diabetes (25) | 1263 (26.2%) |
| Dyslipidemia (21) | 2438 (50.6%) |
| Mean LVEF (%) (10) | 59.6 ± 3.3 |
| Prior or current smoker (23) | 1406 (29.2%) |
| Prior MI (20) | 566 (11.7%) |
| Prior PCI (20) | 1314 (27.3%) |
| Prior CABG (13) | 47 (1%) |
|
BMI, body mass index; CABG, coronary artery bypass grafting; LVEF, left ventricular ejection fraction; MI, myocardial infarction; PCI, percutaneous coronary intervention. Data are expressed as mean value and standard deviation across the studies. |
|
Table 2. Indications for cardiac catheterization
| Indication for cardiac catheterization | (%) |
|---|---|
| Silent isquemia | 323 (6.8) |
| Stable angina | 2483 (51.5) |
| Acute coronary syndrome | 1475 (30.6) |
| Unstable angina | 1142 (23.7) |
| AMI | 333 (6.9) |
| NSTEMI | 204 (4.2) |
| STEMI | 13 (0.3) |
| MI subtype not specified | 116 (2.4) |
| Others | 127 (2.6) |
|
AMI, acute myocardial infarction; MI, myocardial infarction; NSTEMI, non-ST-segment elevation myocardial infarction; STEMI, ST-segment elevation myocardial infarction. |
|

Figure 3. Forest plots and summary statistics for sensitivity and specificity estimates from a meta-analysis of FFR across different indices, using a random-effects model. 95%CI, 95% confidence interval; caFFR, coronary angiography–derived fractional flow reserve; FFR, fractional flow reserve; QFR, quantitative flow ratio; uFR, Murray law-based quantitative flow reserve; VFAI, vessel fractional anatomy index; vFFR, vessel fractional flow reserve. Xu et al.,16 2017; Fearon et al.,36 2019; Yuasa et al.,33 2023; Morris et al.,39 2013; Westra et al.,29 2018; Echavarría-Pinto et al.,31 2022; Stähli et al.,34 2019; Omori et al.,35 2019; Westra et al.,17 2018; Li et al.,18 2020; Pellicano et al.,14 2017; Emori et al.,25 2018; Tu et al.,15 2014; Zuo et al.,24 2024; Tu et al.,19 2021; Omori et al.,42 2023; Hrakesh et al.,32 2020; Kornowski et al.,37 2016; Masdjedi et al.,20 2022; Tröbs et al.,38 2016; Yazaki et al.,30 2017; Smit et al.23 2019; Daemen et al.,43 2022; and Papafaklis et al.,41 2014.

Figure 4. Forest plots and summary statistics for positive predictive value (PPV) and negative predictive value (NPV) estimates from a meta-analysis of FFR across different indices, using a random-effects model. 95%CI, 95% confidence interval; caFFR, coronary angiography–derived fractional flow reserve; FFR, fractional flow reserve; QFR, quantitative flow ratio; uFR, Murray law-based quantitative flow reserve; VFAI, vessel fractional anatomy index; vFFR, vessel fractional flow reserve. Xu et al.,16 2017; Fearon et al.,36 2019; Yuasa et al.,33 2023; Morris et al.,39 2013; Westra et al.,29 2018; Echavarría-Pinto et al.,31 2022; Stähli et al.,34 2019; Omori et al.,35 2019; Westra et al.,17 2018; Li et al.,18 2020; Pellicano et al.,14 2017; Emori et al.,25 2018; Tu et al.,15 2014; Zuo et al.,24 2024; Tu et al.,19 2021; Omori et al.,42 2023; Hrakesh et al.,32 2020; Kornowski et al.,37 2016; Masdjedi et al.,20 2022; Tröbs et al.,38 2016; Yazaki et al.,30 2017; Smit et al.,23 2019; Daemen et al.,43 2022; and Papafaklis et al.,41 2014.
RESULTS
Finally, a total of 27 articles were suitable for inclusion, as illustrated in figure 1. From these articles, a total of 4818 patients and 5440 vessels were added to the analysis. The population characteristics and mean cardiovascular risk factors are detailed in table 1 highlighting the existence of 3189 (66.18%) patients with hypertension, 2438 (50.6%) with dyslipidemia, and 1263 (26.2%) with diabetes. Notably, most patients included in the study were men (68.86% of the sample).
Thirteen of the selected articles were prospective in design. The most extensively studied vessel was the left anterior descending coronary artery (2921; 53.69%), followed by the right coronary artery (1075; 19.61%) and the left circumflex artery (772; 14.2%). Additionally, 89 left main coronary arteries were analyzed, accounting for 1.6% of all vessels. Angiography was primarily performed for stable angina (2483; 51.53%). Of note, while 1475 (30.61%) angiographies were prompted by acute coronary syndrome, only 333 (6.9% of the total) were performed in the context of acute myocardial infarction with or without ST-segment elevation, and the remaining 1142 in the context of unstable angina. Indications for cardiac catheterization are shown in table 2. The left anterior descending coronary artery was the most frequently studied vessel, accounting for 2921 patients (53.7% of the total studies). Proportions for other vessels are available in table 3.
Table 3. Number of studies per vessel performed across the different studies
| Vessel characteristics (n = 5440) | (%) |
|---|---|
| Left main coronary artery | 89 (1.7) |
| Left anterior descending coronary artery | 2921 (53.7) |
| Diagonal branch | 52 (1) |
| Ramus intermedius | 54 (1) |
| Left circumflex artery | 772 (14.2) |
| Obtuse marginal branch | 108 (2) |
| Right coronary artery | 1075 (19.8) |
| Posterolateral branch | 7 (0.1) |
| Interventricular branch | 8 (0.15) |
The QFR15-17,23,25,29-34 (QAngio XA 3D QFR, Medis Medical Imaging System; The Netherlands) was the most widely used software with a total of 13 patient cohorts from 11 articles, comprising 1987 patients and 2315 vessels, which accounts for 41.2% and 42.6% of the total, respectively. The correlation between QFR and FFR was excellent, showing an r = 0.82 (95%CI, 0.77-0.877). The overall sensitivity rate of QFR was 84% (95%CI, 80-88) with a specificity rate of 90% (95%CI, 87-93). The positive predictive value was 81% (95%CI, 77-84) with a total negative predictive value of 92% (95%CI, 90-94). The AUC for this technique was 0.937.
The second most analyzed technique, with a total of 5 articles, was FFRangio14,35-38 (Cathworks FFRangio, Israel), where this technology was employed in 696 patients and 841 vessels (14.4% and 15.45% of the total, respectively). The overall sensitivity rate of FFRangio was 90% (95%CI, 83-94) with a specificity rate of 95% (95%CI, 91-97). The positive predictive value was 90% (95%CI, 85-93) with a total negative predictive value of 94% (95%CI, 91-96).
vFFR (Pie Medical Imaging, The Netherlands) on the other hand, had an excellent correlation with FFR across the 3 included studies,20,39,40 contributing 647 patients and 663 vessels to the analysis (representing 13.42% of patients and 11.96% of vessels). The mean sensitivity and specificity rates were 82% (95%CI, 72-89) and 0.94% (95%CI, 89-97), respectively. The summary positive predictive value was 89% (95%CI, 82-93), and the summary negative predictive value, 91% (95%CI, 86-94).
Following its recent validation in 2022, the uFR (AngioPlus, Pulse Medical Imaging Technology, China) is supported by only 2 articles,19,24 one of which includes 2 cohorts based on vessel calcification. The uFR had a sensitivity rate of 80% (95%CI, 69-87) and a specificity rate of 0.94 (95%CI, 89-97). The summary positive predictive value was 85% (95%CI, 79-90), and the summary negative predictive value, 91% (95%CI, 87-94).
Only 1 article of CaFFR (Flashangio, Rainmed Ltd., China) was included.18
The analysis included 2 non-commercialized tools, VFAI41 and AngioFFR,42 which were not individually evaluated. Both were compared to FFR only once.
Overall, a strong correlation between the different ADPAT and FFR was observed (r = 0.83, 95%CI, 0.80-0.85), with a mean ADPAT value of 0.82 (95%CI, 0.81-0.83) (all the ADPAT set a value ≤ 0.80 for lesion significance) and a mean FFR of 0.83 (95%CI, 0.82-0.85).
The summary AUC for predicting significant FFR (≤ 0.80) was excellent at 0.947. The SROC for the different ADPAT is shown in figure 2.
The overall sensitivity rate was 85% (95%CI, 81-87) with a specificity rate of 93% (95%CI, 91-94). The positive predictive value was 86% (95%CI, 83-88) with a total negative predictive value of 92% (95%CI, 91-94). The main commercially available ADPAT values of sensibility, specificity, positive predictive value and negative predictive value are shown in figure 3 and figure 4.
DISCUSSION
Key findings
Our key findings were: a) ADPAT emerge as a reliable and practical method for assessing the physiological significance of intermediate coronary lesions, which is consistent with previous literature.44-46 ADPAT consistently demonstrates agreement with the current gold standard (FFR) regarding mean values and lesion classification, without vasodilator medication or pressure guidance; b) By summarizing the diagnostic capabilities of each ADPAT from the included studies, we were able to perform the first direct comparison of various angiography-based methods for evaluating coronary lesions. We presented the main commercially available options and their respective diagnostic accuracies relative to FFR. Additionally, an overview of these techniques was provided; c) We also included innovative methods, such as uFR, based on Murray’s Law, while offering a unique approach by using a single projection to estimate lesion significance, potentially overcoming a significant limitation of current techniques, which often require specific projections and a certain quality image.
The overall results confirmed that different ADPAT serve as an appropriate method for evaluating intermediate coronary lesions, as they demonstrated a strong correlation with FFR. This correlation extended to sensitivity, specificity, and predictive values as illustrated in figure 4. Notably, the studies exhibited homogeneity without significant discrepancies in their weighting within the analysis, as observed through the resampling techniques employed.
In comparative analysis, while ADPAT exhibit adequate sensitivity and positive predictive values regarding lesion significance, their specificity and negative predictive value exceed 90%. This high specificity allows ADPAT to more accurately identify physiologically non-significant lesions, thereby avoiding unnecessary revascularization.
From a technical standpoint, it was notable that these results were primarily obtained from assessments of the left anterior descending coronary artery (53.6%), with only 1 dedicated study on the left main coronary artery. Despite this, left main coronary arteries contributed a significant proportion (1.66%) to the overall analysis, showcasing proficient classification of significant lesions (AUC = 0.82) and indicating the feasibility of applying tools in this context.
QFR was the most frequently included tool in the analysis, representing 13 out of 27 cohorts. Despite multiple validations vs the FFR in diverse contexts, most studies align closely, demonstrating a correlation between QFR and FFR.
Comparing results across different tools, minimal differences were observed, with FFRangio and CaFFR showing slightly superior overall results vs other methods. However, it’s important to note that the results of the CaFFR are based solely on validation articles, and when considering only validation studies, results among tools are very similar.
Although QFR is frequently studied, its results might require more robust validation because there are limited articles on FFRangio, especially on chronic coronary syndrome in patient groups like those with left main disease or diabetes.
While ADPAT have been validated vs the FFR in various clinical scenarios, such as severe aortic stenosis, atrial fibrillation, or non-culprit coronary lesions in acute coronary syndrome, the inclusion of these scenarios in our analysis could potentially bias the results due to variations in study characteristics and the unique features of each disease affecting lesion assessment.
The limitation of this study stems from including a large proportion of pivotal studies for each analyzed tool, which were not performed under real-world clinical conditions. Consequently, the applicability of their results may be restricted, as demonstrated by a recent study from independent laboratories comparing the 5 main non-hyperemic indices with FFR under real-life conditions.47
Although the study demonstrated a good correlation between the indices and FFR, the levels of diagnostic accuracy reported in the pivotal studies were not achieved.
In this regard, QFR has been recently evaluated vs the FFR in the FAVOR III Europe trial,1 which included 2000 patients who were randomized (1:1) to QFR-guided or FFR-guided treatment of intermediate lesions. The results showed that the QFR-guided group had higher rates of mortality, myocardial infarction, and unplanned revascularization at 12 months.
Although these findings may initially seem discouraging, they do not contradict the results of our study, in which non-hyperemic indices demonstrated superior performance over conventional angiography in the functional classification of lesions. Therefore, their use remains valuable in clinical scenarios where invasive assessment with a pressure guidewire or the use of adenosine is not feasible or contraindicated.
Of note, while QFR is currently the most widely used non-hyperemic index, it is the only one that has been evaluated in clinical trials with hard clinical endpoints vs FFR. Other tools with promising results are still to be investigated in this context.
CONCLUSIONS
Substantial correlations and concordances have been demonstrated between ADPAT and FFR. These techniques have also shown accurate categorization of lesions deemed significant by the current gold standard (FFR). However, the results of the FAVOR III Europe study1 indicate that QFR–guided revascularization, compared with FFR-guided revascularization, is associated with higher rates of mortality, myocardial infarction, and unplanned revascularization. Therefore, the current role of ADPAT requires re-evaluation.
In this context, the use of QFR may be most appropriate when invasive assessment using a pressure guidewire is not feasible or when adenosine is contraindicated. Additionally, due to the unique characteristics of other clinical scenarios, further reviews are warranted to evaluate the diagnostic accuracy of this index.
FUNDING
C. Cortés-Villar has been beneficiary of Río Hortega CM22/00168 and Miguel Servet CP24/00128 grants from Instituto de Salud Carlos III. This work has been partially funded by Gerencia Regional de Salud de Castilla y León with grant number GRS 3157/A1/2024.
ETHICAL CONSIDERATIONS
The present study was conducted in full compliance with the clinical practice guidelines set forth in the Declaration of Helsinki for clinical research and was approved by the ethics committees of the reference hospital (Hospital Clínico Universitario de Valladolid) and other participant centers. Possible sex- and gender-related biases were also taken into consideration according to the SAGER recommendations.
STATEMENT ON THE USE OF ARTIFICIAL INTELLIGENCE
No artificial intelligence was used in the writing of this text.
AUTHORS’ CONTRIBUTIONS
J. Ruiz-Ruiz and C. Cortés-Villar participated in the study design, data analysis, manuscript drafting, and critical revision. C. Fernández-Cordón and M. García-Gómez contributed to data collection and results analysis. A. Lozano-Ibáñez and D. Carnicero-Martínez contributed to data gathering. S. Blasco-Turrión and M. Carrasco-Moraleja contributed to the statistical analysis. J.A. San Román-Calvar and I.J. Amat-Santos performed the final review and approved the version for publication.
CONFLICTS OF INTEREST
None declared.
SUPPLEMENTARY DATA

REFERENCES
1. Andersen BK, Sejr-Hansen M, Maillard L, et al. Quantitative flow ratio versus fractional flow reserve for coronary revascularisation guidance (FAVOR III Europe):a multicentre, randomised, non-inferiority trial. Lancet. 2024;404:1835-1846.
2. Patil CV, Beyar R. Intermediate coronary artery stenosis:Evidence-based decisions in interventions to avoid the oculostenotic reflex. Int J Cardiovasc Intervent. 2000;3:195-206.
3. Gould KL, Lipscomb K, Hamilton GW. Physiologic basis for assessing critical coronary stenosis. Instantaneous flow response and regional distribution during coronary hyperemia as measures of coronary flow reserve. Am J Cardiol. 1974;33:87-94.
4. De Bruyne B, Paulus WJ, Vantrimpont PJ, Sys SU, Heyndrickx GR, Pijls NHJ. Transstenotic coronary pressure gradient measurement in humans:In vitro and in vivo evaluation of a new pressure monitoring angioplasty guide wire. J Am Coll Cardiol. 1993;22:119-126.
5. Sousa-Uva M, Neumann FJ, Ahlsson A, et al. 2018 ESC/EACTS Guidelines on myocardial revascularization. Eur J Cardio-thoracic Surg. 2019;55:4-90.
6. Tonino PAL, De Bruyne B, Pijls NHJ, et al. Fractional flow reserve versus angiography for guiding percutaneous coronary intervention. N Engl J Med. 2011;365:213-224.
7. De Bruyne B, Pijls NHJ, Kalesan B, et al. Fractional Flow Reserve–Guided PCI versus Medical Therapy in Stable Coronary Disease. N Engl J Med. 2012;367:991-1001.
8. Johnson NP, Koo BK. Coronary Psychology:Do You Believe?JACC Cardiovasc Interv. 2018;11:1492-1494.
9. De Waard GA, Di Mario C, Lerman A, Serruys PW, Van Royen N. Instantaneous wave-free ratio to guide coronary revascularisation:Physiological framework, validation and differences from fractional flow reserve. EuroIntervention. 2017;13:450-458.
10. Svanerud J, Ahn JM, Jeremias A, et al. Validation of a novel non-hyperaemic index of coronary artery stenosis severity:The Resting Full-cycle Ratio (VALIDATE RFR) study. EuroIntervention. 2018;14:806-814.
11. Davies JE, Sen S, Dehbi H-M, et al. Use of the Instantaneous Wave-free Ratio or Fractional Flow Reserve in PCI. N Engl J Med. 2017;376:1824-1834.
12. Götberg M, Christiansen EH, Gudmundsdottir IJ, et al. Instantaneous Wave-free Ratio versus Fractional Flow Reserve to Guide PCI. N Engl J Med. 2017;376:1813-1823.
13. Min JK, Leipsic J, Pencina MJ, et al. Diagnostic accuracy of fractional flow reserve from anatomic CT angiography. Jama. 2012;308:1237-1245.
14. Pellicano M, Lavi I, De Bruyne B, et al. Validation study of image-based fractional flow reserve during coronary angiography. Circ Cardiovasc Interv. 2017;10:E005259.
15. Tu S, Barbato E, Köszegi Z, et al. Fractional flow reserve calculation from 3-dimensional quantitative coronary angiography and TIMI frame count:A fast computer model to quantify the functional significance of moderately obstructed coronary arteries. JACC Cardiovasc Interv. 2014;7:768-777.
16. Xu B, Tu S, Qiao S, et al. Diagnostic Accuracy of Angiography-Based Quantitative Flow Ratio Measurements for Online Assessment of Coronary Stenosis. J Am Coll Cardiol. 2017;70:3077-3087.
17. Westra J, Andersen BK, Campo G, et al. Diagnostic performance of in-procedure angiography-derived quantitative flow reserve compared to pressure-derived fractional flow reserve:The FAVOR II Europe-Japan study. J Am Heart Assoc. 2018;7:e009603.
18. Li J, Gong Y, Wang W, et al. Accuracy of Computational Pressure-Fluid Dynamics applied to Coronary Angiography to Derive Fractional Flow Reserve –FLASH FFR. Cardiovasc Res. 2020;116:1349-1356.
19. Tu S, Ding D, Chang Y, Li C, Wijns W, Xu B. Diagnostic accuracy of quantitative flow ratio for assessment of coronary stenosis significance from a single angiographic view:A novel method based on bifurcation fractal law. Catheter Cardiovasc Interv. 2021;97(S2):1040-1047.
20. Masdjedi K, Tanaka N, Van Belle E, et al. Vessel fractional flow reserve (vFFR) for the assessment of stenosis severity:the FAST II study. EuroIntervention. 2022;17:1498-1505.
21. Masdjedi K, van Zandvoort LJC, Balbi MM, et al. Validation of a three-dimensional quantitative coronary angiography-based software to calculate fractional flow reserve:The FAST study. EuroIntervention. 2021;16:591-599.
22. Ai H, Zheng N, Li L, et al. Agreement of Angiography-Derived and Wire-Based Fractional Flow Reserves in Percutaneous Coronary Intervention. Front Cardiovasc Med. 2021;8:654392.
23. Smit JM, El Mahdiui M, van Rosendael AR, et al. Comparison of Diagnostic Performance of Quantitative Flow Ratio in Patients With Versus Without Diabetes Mellitus. Am J Cardiol. 2019;123:1722-1728.
24. Zuo W, Sun R, Xu Y, et al. Impact of calcification on Murray law-based quantitative flow ratio for physiological assessment of intermediate coronary stenoses. Cardiol J. 2024;31:205-214.
25. Emori H, Kubo T, Kameyama T, et al. Diagnostic accuracy of quantitative flow ratio for assessing myocardial ischemia in prior myocardial infarction. Circ J. 2018;82:807-814.
26. Deeks JJ. Systematic reviews of evaluations of diagnostic and screening tests. Bmj. 2001;323:157.
27. Walter SD. Properties of the summary receiver operating characteristic (SROC) curve for diagnostic test data. Stat Med. 2002;21:1237-1256.
28. Whiting PF, Reitsma JB, Leeflang MMG, et al. QUADAS-2:a revised tool for the quality assessment of diagnostic accuracy studies. Ann Intern Med. 2011;155:529-536.
29. Westra J, Tu S, Winther S, et al. Evaluation of Coronary Artery Stenosis by Quantitative Flow Ratio during Invasive Coronary Angiography:The WIFI II Study (Wire-Free Functional Imaging II). Circ Cardiovasc Imaging. 2018;11:1-8.
30. Yazaki K, Otsuka M, Kataoka S, et al. Applicability of 3-dimensional quantitative coronary angiography-derived computed fractional flow reserve for intermediate coronary stenosis. Circ J. 2017;81:988-992.
31. Echavarría-Pinto M, Van de Hoef TP, Pacheco-Beltran N, et al. Diagnostic agreement of quantitative flow ratio with fractional flow reserve in a Latin-American population. Int J Cardiovasc Imaging. 2022;38:1423-1430.
32. Hrakesh O, Hay M, Lim RY, et al. Comparison of diagnostic performance between quantitative flow ratio, non-hyperemic pressure indices and fractional flow reserve. Cardiovasc Diagn Ther. 2020;10:442-452.
33. Yuasa S, Lauri FM, Mejia-Renteria H, et al. Angiography-derived functional assessment of left main coronary stenoses. Catheter Cardiovasc Interv. 2023;101:1045-1052.
34. Stähli BE, Erbay A, Steiner J, et al. Comparison of resting distal to aortic coronary pressure with angiography-based quantitative flow ratio. Int J Cardiol. 2019;279:12-17.
35. Omori H, Witberg G, Kawase Y, et al. Angiogram based fractional flow reserve in patients with dual/triple vessel coronary artery disease. Int J Cardiol. 2019;283:17-22.
36. Fearon WF, Achenbach S, Engstrom T, et al. Accuracy of Fractional Flow Reserve Derived from Coronary Angiography. Circulation. 2019;139:477-484.
37. Kornowski R, Lavi I, Pellicano M, et al. Fractional Flow Reserve Derived From Routine Coronary Angiograms. J Am Coll Cardiol. 2016;68:2235-2237.
38. Tröbs M, Achenbach S, Röther J, et al. Comparison of Fractional Flow Reserve Based on Computational Fluid Dynamics Modeling Using Coronary Angiographic Vessel Morphology Versus Invasively Measured Fractional Flow Reserve. Am J Cardiol. 2016;117:29-35.
39. Morris PD, Ryan D, Morton AC, et al. Virtual fractional flow reserve from coronary angiography:Modeling the significance of coronary lesions. Results from the VIRTU-1 (VIRTUal fractional flow reserve from coronary angiography) study. JACC Cardiovasc Interv. 2013;6:149-157.
40. Neleman T, Masdjedi K, Van Zandvoort LJC, et al. Extended Validation of Novel 3D Quantitative Coronary Angiography-Based Software to Calculate vFFR:The FAST EXTEND Study. JACC Cardiovasc Imaging. 2021;14:504-506.
41. Papafaklis MI, Muramatsu T, Ishibashi Y, et al. Fast virtual functional assessment of intermediate coronary lesions using routine angiographic data and blood flow simulation in humans:Comparison with pressure wire - fractional flow reserve. EuroIntervention. 2014;10:574-583.
42. Omori H, Kawase Y, Mizukami T, et al. Diagnostic Accuracy of Artificial Intelligence-Based Angiography-Derived Fractional Flow Reserve Using Pressure Wire-Based Fractional Flow Reserve as a Reference. Circ J. 2023;87:783-790.
43. Scoccia A, Tomaniak M, Neleman T, Groenland FTW, Plantes ACZ des, Daemen J. Angiography-Based Fractional Flow Reserve:State of the Art. Curr Cardiol Rep. 2022;24:667-678.
44. Cortés C, Carrasco-Moraleja M, Aparisi A, et al. Quantitative flow ratio—Meta-analysis and systematic review. Catheter Cardiovasc Interv. 2021;97:807-814.
45. Faria D, Hennessey B, Shabbir A, et al. Functional coronary angiography for the assessment of the epicardial vessels and the microcirculation. EuroIntervention. 2023;19:203-221.
46. Leone AM, Campo G, Gallo F, et al. Adenosine-Free Indexes vs. Fractional Flow Reserve for Functional Assessment of Coronary Stenoses:Systematic Review and Meta-Analysis. Int J Cardiol. 2020;299:93-99.
47. Ninomiya K, Serruys PW, Kotoku N, et al. Anonymous Comparison of Various Angiography-Derived Fractional Flow Reserve Software With Pressure-Derived Physiological Assessment. JACC Cardiovasc Interv. 2023;16:1778-1790.
ABSTRACT
Introduction and objectives: Several tools have been implemented to assess the functional significance of coronary lesions. Their reliability in the management of acute coronary syndrome (ACS) might be affected by alterations in the acute phase that go beyond the affected area. Our main objective was to evaluate the reliability of invasive physiological indices for non-culprit lesions (NCL) in patients with ACS.
Methods: We conducted a systematic review across ClinicalTrials.gov, Embase, Google Scholar, PubMed, and Web of Science from inception through 5 December 2024. Additionally, a citation analysis and web searches were conducted.
Results: A total of 20 articles, with 4379 patients were included in the analysis. The main study design is a cohort study. The following methods were compared between acute and staged interventions: a) angiography-derived; b) hyperemic; and c) non-hyperemic indices. A significant difference in fractional flow reserve, instantaneous wave-free ratio, and quantitative flow ratio was found in one or more articles. There were no articles reporting any important changes in the Murray law-based quantitative flow ratio, resting distal-to-aortic coronary pressure ratio, or vessel fractional flow reserve. However, these indices rely on retrospective and/or limited data. All significant variations were observed in cohorts of ST-segment elevation myocardial infarction. Unlike quantitative flow ratio, the fractional flow reserve and instantaneous wave-free ratio demonstrated consistent directions of change towards lower and higher values, respectively. Prospective cohorts and randomized controlled trials including non-ST-segment elevation acute coronary syndrome did not prove the existence of significant differences between acute and follow-up fractional flow reserve.
Conclusions: Physiological methods lack complete reliability for evaluating NCL during acute ST-segment elevation myocardial infarction. However, considering directions of change, fractional flow reserve is suitable for guiding the revascularization of acute positive NCL. Conversely, instantaneous wave-free ratio can be used to defer the revascularization of negative NCL. In non-ST-segment elevation acute coronary syndrome, fractional flow reserve is appropriate for assessing NCL within the acute phase.
Keywords: Fractional flow reserve. Instantaneous wave-free ratio. Quantitative flow ratio.
RESUMEN
Introducción y objetivos: Se han implementado varias herramientas para evaluar la importancia funcional de las lesiones coronarias. Su fiabilidad en el síndrome coronario agudo (SCA) podría verse afectada por perturbaciones en la fase aguda que se extienden más allá de la zona afectada. Nuestro objetivo principal fue evaluar la fiabilidad de los índices fisiológicos invasivos para las lesiones no culpables (LNC) en pacientes con SCA.
Métodos: Se realizó una revisión sistemática en ClinicalTrials.gov, Embase, Google Scholar, PubMed y Web of Science, desde el inicio hasta el 06/12/2024. Además, se hizo un análisis de citas y búsquedas en la web.
Resultados: Se incluyeron en el análisis 20 estudios, que abarcaban 4.379 pacientes. El principal diseño de estudio es el de cohorte. Se compararon los siguientes métodos entre procedimientos agudos y diferidos: a) índices derivados de la angiografía; b) índices hiperémicos; y c) índices no hiperémicos. En uno o más artículos se hallaron diferencias significativas en la reserva fraccional de flujo, el índice diastólico instantáneo sin ondas y el cociente de flujo cuantitativo. Ningún artículo informó de cambios importantes en el cociente de flujo cuantitativo basado en la ley de Murray, el cociente de presión coronaria distal-aórtica en reposo o la reserva fraccional de flujo del vaso. Sin embargo, estos estudios se basan en datos retrospectivos o limitados. Todas las variaciones significativas se observaron en cohortes de pacientes con infarto de miocardio con elevación del segmento ST. A diferencia del cociente de flujo cuantitativo, la reserva fraccional de flujo y el índice diastólico instantáneo sin ondas mostraron direcciones de cambio coherentes, hacia valores más bajos y más altos, respectivamente. Las cohortes prospectivas y los ensayos controlados aleatorizados que incluyeron pacientes con infarto de miocardio sin elevación del segmento ST no encontraron diferencias importantes entre la reserva fraccional de flujo aguda y la diferida.
Conclusiones: Los métodos fisiológicos no tienen una total fiabilidad para evaluar la gravedad de las LNC durante el infarto agudo de miocardio con elevación del segmento ST. Sin embargo, teniendo en cuenta las direcciones del cambio, la reserva fraccional de flujo es adecuada para guiar la revascularización de una LNC positiva en la fase aguda. Por el contrario, el índice diastólico instantáneo sin ondas se puede utilizar para aplazar la revascularización de una LNC con valoración negativa. En el SCA sin elevación del segmento ST, la reserva fraccional de flujo es adecuada para evaluar una LNC en la fase aguda.
Palabras clave: Reserva fraccional de flujo. Indice diastolico instantaneo sin ondas. Cociente de flujo cuantitativo.
Abbreviations
ACS: acute coronary syndrome. FFR: fractional flow reserve. iFR: instantaneous wave-free ratio. NCL: non-culprit lesions. QFR: quantitative flow ratio.
INTRODUCTION
The optimal strategy and timing of complete revascularization in patients with ST-segment elevation myocardial infarction (STEMI) and multivessel coronary artery disease remains unclear, and current recommendations are controversial.1 According to 2023 European Society of Cardiology (ESC) guidelines, complete revascularization, based solely on angiographic severity, is recommended in “stable” STEMI patients.2 Conversely, the 2023 Asia-Pacific Expert Consensus Document suggested a treatment strategy of non-culprit lesions (NCL) based on angiographic severity and invasive physiological assessment with fractional flow reserve (FFR) or non-hyperemic pressure ratios for patients with STEMI.3
FFR and non-hyperemic pressure ratios may be inaccurate in acute coronary syndrome (ACS), as hyperemic flow may be reduced due to microcirculatory dysfunction, while the resting flow may be higher due to neurohumoral compensatory mechanisms.4
Angiography-derived indices are additional physiological tools. They need ≥ 1 angiographic projections plus frame count analysis and/or aortic pressure that may also be different in the acute setting.
Furthermore, drugs such as hypolipidemic agents may promote plaque regression, potentially impacting the results of physiological assessment after a few months into therapy.5
Our main objective was to evaluate the changes in invasive physiological measurements of NCL between the acute and staged phases of ACS.
Secondly, we aimed to evaluate the effects of different therapies on physiological measurements.
METHODS
Eligibility criteria
We included studies that evaluated the physiology of NCL during acute and staged interventions for ACS. Studies conducted on assessments following percutaneous coronary interventions of non-culprit vessels, or with patients with chronic coronary syndrome were excluded.
Case reports, conference abstracts, commentaries, editorials, and reviews were excluded as well. An initial protocol was registered in PROSPERO with registration No. CRD42024574683.
Search strategy, and study selection
We conducted the search across ClinicalTrials.gov, Embase (via Ovid), Google Scholar, PubMed, and Web of Science from inception through 26 April 2024 (initial search). We used the “Review articles” filter in Google Scholar and the “Topic” field in Web of Science. No language restrictions were applied.
Duplicates were removed using Deduplicator (SR-Accelerator) software. Title/abstract and full text screening was conducted independently by 2 authors using Rayyan software.
Back in July, 2 authors conducted a backward and forward citation analysis of the included articles using Citationchaser software.
The search strings were repeated in 6 December 2024 (in Embase, sources with invalid date limits were excluded). Simultaneously, we looked into any online conference news on imaging modalities and physiological measurements.6 Additionally, we looked into the “Slide Library” section using the “2024” filter on another web page.7
Finally, we manually reviewed the references of the articles included after the initial search.
All discrepancies were resolved by consensus.
Selection process was recorded in sufficient detail to complete a Preferred Reporting Items for Systematic reviews and Meta-Analyses (PRISMA) flow diagram.8
Data extraction
The following data were extracted from each article: a) study characteristics; b) population characteristics; c) type of physiological index(es); d) follow-up duration; e) primary endpoint.
The primary endpoint was the variation between acute and staged indices regarding statistical significance, mean difference (MD), and disagreement on revascularization decision.
One author extracted the data, and another one checked it independently. We contacted the authors of eligible studies when clarifications were needed.
Risk of bias assessment
Risk of bias was assessed using the Joanna Briggs Institute (JBI) critical appraisal tools,9-11 as appropriate.
Two authors independently assessed the risk of bias for each study. We used red for high, yellow for moderate, and green for low risk of bias based on positive answers being ≤ 49%, 50%-69%, or ≥ 70%.
Data synthesis
We conducted a descriptive synthesis of the evidence. Results from data extraction were shown in separate tables based on risk of bias, or bubble charts. Some data were rounded to the nearest integer (age, diameter of stenosis of NCL, and follow-up) or 2 decimal places (MD).
Unless otherwise specified, P values < .05 were considered statistically significant. When MDs were unreported, they were estimated by calculating the difference between staged and acute mean values. When required, a formula for estimating the means was applied.12
In bubble charts, the size of the bubbles represents the number of patients or lesions if the former was not reported. Acute−/staged+ disagreement indicates an acute value above the threshold, with the staged value below the revascularization cut-off. Acute+/staged− disagreement represents the opposite.
RESULTS
Characteristics of the articles, participants, and indices
Results of the search and selection processes are shown in figure 1. Extracted data are shown in table 1 and table 2.

Figure 1. PRISMA flow diagram. PRISMA, preferred reporting items for systematic reviews and meta-analyses.
Table 1. Extracted data of studies with low risk of bias
| First author | Patients (No.) | Age (years) | STEMI (%) | PDS of NCL (%) | Type of index | Follow-up (days) | Comparison across measurements | |
|---|---|---|---|---|---|---|---|---|
| P-value | Mean difference (staged−acute value) | |||||||
| Bär13 | 94a | 59 ± 10 | 53 | 37 ± 8 | cQFR | 365 | NR | 0.00 |
| 99b | 58 ± 8 | 54 | 37 ± 8 | NR | − 0.01 | |||
| Cortés14 | 88 | 68 ± 11 | 100 | 59 ± 12 | cQFR | 6 ± 4 | S | + 0.06 |
| Erbay15 | 321 | 66 [58-76] | 50.5c | 47 [36-57] | cQFR | 49 [42-58] | NS | + 0.01 |
| Hou16 | 2256 | 64 ± 6 | 100 | 65 ± 9 | muQFR | (7-45) | NS | 0.00 |
| Huang17 | 92 | 65 ± 10 | 100 | (30-80) | vFFR | 15 [3-30] | NS | 0.00 |
| Kirigaya18 | 50 | 63 ± 11 | 100 | 46 ± 13 | cQFR | 14 ± 5 | NS | + 0.01 |
| Mensink19 | 150d | 64 ± 9 | 35.3 | NR | FFR | 84 | NR | 0.00 |
| Musto20 | 50 | 68 ± 11 | 100 | 58 ± 12 | FFR | 6 ± 2 | NS | 0.00 |
| iFR | NS | 0.00 | ||||||
| Ntalianis21 | 101 | 63 ± 12 | 74.2 | 56 ± 14 | FFR | 35 ± 4 | NS | 0.00 |
| Sejr-hansen22 | NRe | NR | 100 | 56 [48-66] | cQFR | 13 [7-31] | NS | − 0.02 |
| iFR | S | + 0.02 | ||||||
| Shukla23 | 31 | 56 ± 8 | 100 | 78 ± 9 | FFR | 18 ± 4 | S | − 0.01 |
| Thim24 | 120 | 66 ± 11 | 100 | 50 [41-59] | iFR | 16 [5-32] | S | + 0.03 |
| Van der Hoeven25 | 73 | 61 ± 10 | 100 | 55 ± 13 | FFR | 31 ± 6 | S | − 0.03 |
| iFR | NS | + 0.01 | ||||||
| Resting Pd/Pa | NS | + 0.01 | ||||||
| Wang26 | 70 | 62 | 100 | NR | QFR | 30 | NS | − 0.01 |
| FFR | S | − 0.03 | ||||||
| Zhao27 | 102f | 66 ± 6 | 100 | 64 ± 5 | cQFR | 365 | NR | + 0.01 |
| 253g | 65 ± 6 | 64 ± 6 | NR | − 0.01 | ||||
|
cQFR, contrast quantitative flow ratio; FFR, fractional flow reserve; iFR, instantaneous wave-free ratio; muQFR, Murray law-based QFR; NCL, non-culprit lesions; NR, not reported; NS, non-significant; Pd/Pa, distal-to-aortic coronary pressure ratio; QFR, quantitative flow ratio; PDS, percent diameter stenosis; S, significant; STEMI, ST-segment elevation myocardial infarction; vFFR, vessel fractional flow reserve. Data are expressed as mean, mean ± standard deviation or median [interquartile range] or (range) (age, PDS of NCL, follow-up). a Statin + alirocumab subgroup. b Statin + placebo subgroup. c Percentage of ST-segment elevation acute coronary syndrome. d Overall population (statin + evolocumab or placebo subgroups). e No. of lesions analyzed: 70. f Statin + evolocumab subgroup. g Statin monotherapy subgroup. |
||||||||
A total of 20 articles were included13-32 (1 article in the form of a conference presentation).19 Publication years went from 2010 through 2024. The total number of reported patients was 4379.
In every publication, the patients are predominantly men and non-diabetic. The main clinical presentation was STEMI, except for 3 studies.19,29,31
The following methods were assessed: a) angiography-derived: Murray law-based quantitative flow ratio (muQFR), quantitative flow ratio (QFR), vessel FFR (vFFR); b) hyperemic (FFR); and c) non-hyperemic indices: instantaneous wave-free ratio (iFR), resting distal-to-aortic coronary pressure ratio (Pd/Pa). When reported, the FFR was obtained using adenosine.
Reported patients for each index are as follows: 2340 (muQFR), 1187 (QFR), 710 (FFR), 243 (iFR), 92 (vFFR), and 73 (resting Pd/Pa).
Risk of bias
The studies mainly used an observational (cohort) design. Cohort studies on angiography-derived methods were retrospective, except for 1 article on QFR.28 Those on FFR and non-hyperemic indices were prospective, except for 2 substudies.22,26
QFR was also evaluated by 1 quasi-experimental study27 and 1 randomized controlled trial.13
Finally, the FFR was assessed by 2 randomized controlled trials, in samples with predominance of non-ST-segment elevation myocardial infarction (NSTEMI).19,31,33
Results are shown in table 1 of the supplementary data, table 2 of the supplementary data, and table 3 of the supplementary data. There were no studies with high risk of bias.
Table 2. Data drawn from studies with moderate risk of bias
| First author | Patients (No.) | Age (years) | STEMI (%) | PDS of NCL (%) | Type of index | Follow-up (days) | Comparison across measurements | |
|---|---|---|---|---|---|---|---|---|
| P-value | Mean difference (staged−acute value) | |||||||
| Barauskas28 | 79 | NR | 100 | (35-75) | QFR | ≥ 91 | NSa | − 0.02 |
| Jo29 | 115 | 60 ± 12 | 32.2 | NR | FFR | 182 | NS | − 0.01 |
| Li30 | 84 | 60 ± 11 | 100 | (50-90) | muQFR | 8 ± 2 | NS | 0.00 |
| Park31 | 60b | 57 ± 11 | 30 | NR | FFR | 182 | NS | − 0.02 |
| 60c | 59 ± 10 | 33.3 | NR | NS | − 0.01 | |||
| Spitaleri32 | 31 | 64 ± 12 | 100 | 59 ± 13 | cQFR | (3-4) | NS | 0.00 |
|
cQFR, contrast quantitative flow ratio; FFR, fractional flow reserve; muQFR, Murray law-based QFR; NCL, non-culprit lesions; NS, non-significant; NR, not reported; PDS, percent diameter stenosis; QFR, quantitative flow ratio; STEMI, ST-segment elevation myocardial infarction. Data are expressed as ≥ lower limit or mean or mean ± standard deviation or (range) (age, PDS of NCL, follow-up). a Level of significance was set at P < .001. b Ticagrelor subgroup. c Clopidogrel subgroup. |
||||||||
Primary endpoint
Statistical significance
There were no articles on relevant changes in muQFR,16,30 resting Pd/Pa,25 and vFFR17 at the follow-up.
A significant difference in FFR, iFR, and QFR was found in 3, 2, and 1 article(s),14,22-26 respectively. In 1 study, the difference in QFR was non-significant, with a significance threshold of .001.28
These variations were seen in cohorts of STEMI patients.14,22-26 Studies including non-ST-segment elevation acute coronary syndrome (NSTEACS) did not show any relevant differences regarding the QFR15 or the FFR.19,21,29,31
A total of 4 articles20,22,25,26 evaluated > 1 method. The iFR and FFR were both stable in the study by Musto et al.,20 while the iFR was more stable than the FFR in a different article.25 The QFR was compared to both the FFR26 and the iFR.22 Unlike these indices, the QFR did not show any significant changes in staged phases.22,26
Mean differences
The most valued indices showed varying results. muQFR had MD values close to 0 in both studies.16,30
QFR variations were observed at both lower22,26,28 and higher values.14,15,18 Conversely, the FFR and the iFR varied towards smaller and greater values, respectively.22-26,29,31 Their MDs ranged from − 0.02 to + 0.06 (QFR), − 0.03 to 0.00 (FFR), and 0.00 to + 0.03 (iFR).14,19-21,24,25,28 MD values of 0.01 were observed more often.
In STEMI patients, the MDs of the FFR, the iFR, and the QFR were close to 0 only in studies with mean follow-ups of < 1 week.20,32 In studies including NSTEACS, the FFR MDs were close to 0 after longer mean follow-ups (> 1 month).19,21 Furthermore, Ntalianis et al. showed a greater stability of FFR in patients with NSTEMI (MD, 0.00) vs those with STEMI (MD, − 0.02).21
Disagreement
Disagreement in the indication for revascularization is shown in figure 2. MDs of 0.01 resulted in variable disagreements: 5%-18%.15,18,23,25

Figure 2. Disagreement between acute and staged values in the indication for PCI. B, Barauskas; C, Cortés; E, Erbay; FFR, fractional flow reserve; H, Huang; iFR, instantaneous wave-free ratio; K, Kirigaya; L, Li; muQFR, Murray law-based QFR; N, Ntalianis; PCI, percutaneous coronary intervention; QFR, quantitative flow ratio; SE, Sejr-Hansen; SH, Shukla; SP, Spitaleri; T, Thim; V, van der Hoeven; vFFR, vessel fractional flow reserve.
Unlike the QFR, the FFR and the iFR consistently showed a higher frequency of one type of disagreement: acute−/staged+ for FFR,21,23,25 and acute+/staged− for iFR.24,25
Secondary endpoint
A total of 4 studies compared the effects of different drugs on the physiological parameters.13,19,27,31
Ticagrelor (which can increase the levels of adenosine) was compared to clopidogrel and no significant differences were found in the FFR of non-culprit vessels after 6 months of treatment.31
Another 3 studies compared a proprotein convertase subtilisin/kexin type 9 (PCSK9) inhibitor (eg, alirocumab or evolocumab) plus high-intensity statin (HIST) (eg, rosuvastatin 20 mg/day) vs statin-only therapy.13,19,27
In a nonrandomized study, the QFR values were significantly higher in the evolucumab group at 12 months.27 However, in 2 randomized studies, no significant differences were observed across the 2 treatment groups in the QFR at 12 months or in the FFR at 3 months, respectively.13,19
DISCUSSION
The main findings of this systematic review are these: firstly, in STEMI patients, the muQFR, resting Pd/Pa, and vFFR indices remained relatively stable in retrospective and/or small studies. The FFR, iFR, and QFR showed variability between acute and staged phases. Secondly, the FFR did not change significantly in prospective cohorts or randomized controlled trials including NSTEACS. Thirdly, the QFR was more stable than both the FFR and the iFR in direct comparisons, although only the FFR and the iFR exhibited consistent directions of change. Fourthly, PCSK9 inhibitors added to HIST did not influence physiological measurements compared with HIST in randomized controlled trials.
The muQFR demonstrated stability in a large sample of patients. This index is based on a single angiographic view, unlike other angiography-based methods that require 2 angiographic projections. This characteristic might reduce observer variability and enhance reliability. Future prospective and comparative studies are needed to confirm the validity of this method.
Although low variations for FFR, iFR, and QFR were observed in cohorts of STEMI patients,20,32 these studies were limited by short-term follow-ups. Thim et al. found a non-significant change in the iFR with 5-day follow-ups, whereas there were significant changes with ≥ 5 day follow-ups.24 Therefore, physiological disarrangements initiated at the acute moment of STEMI might still exist if a staged procedure is conducted close to the index event.24,25
Angiographic, hemodynamic, and microcirculatory variables may alter acute physiologic assessment and account for the higher reliability of the FFR in NSTEACS vs STEMI.
In patients with microvascular dysfunction, epicardial blood flow cannot increase sufficiently during maximal hyperemia, thus causing a reduced pressure gradient across the stenotic lesion,29 and higher FFR values.
In STEMI patients, microcirculatory indices (coronary flow reserve and index of microcirculatory resistance) were significantly worse during the acute phase, along with a higher FFR.25 Conversely, studies including NSTEACS did not show any significant differences in the coronary flow reserve and/or index of microcirculatory resistance at the follow-up.21,29,31
Furthermore, STEMI patients showed greater acute angiographic severity, along with lower QFR or iFR values,14,22 which may be attributed to vasoconstriction typically occurring during the acute phase.
Consequently, the FFR seems more reliable in NSTEACS vs STEMI due to reduced acute microcirculatory impairment and/or vasoconstriction.
Literature trials support the use of the FFR in NCL of NSTEMI during the acute phase (eg, within the index hospitalization).34,35 In contrast, acute FFR-guided complete revascularization did not show any significant benefits in terms of death or myocardial infarction in STEMI patients.36-39
The higher stability of QFR when directly compared to the FFR or the iFR was limited to a small number of patients in post-hoc substudies.22,26 A MD of 0.01 sometimes led to non-trivial disagreement on revascularization decision,25 likely due to baseline values being near the cut-off. Therefore, it is essential to have an index which remains stable or demonstrates consistent changes, such as the FFR and the iFR. Similarly, these indices demonstrated a greater frequency of a specific type of disagreement (methodological variations–wire positioning–may explain the less frequent cases of disagreement).24
Therefore, the FFR and the iFR could be considered in the acute STEMI as an alternative to delayed assessments,25 considering that the FFR tends to decrease and the iFR tends to increase. The FFR could guide the revascularization of positive lesions (FFR ≤ 0.80).25 In patients with a FFR > 0.80, acute iFR assessment can be used to delay the revascularization of negative NCL (iFR > 0.89).24 In the remaining cases (iFR ≤ 0.89), some authors suggested a staged reevaluation.24 At least 5 days after the index procedure should go by. This was the minimum time needed to observe the initial resolution of acute physiological disturbances.24
Finally, when plaques are correctly identified as functionally negative, they may still be vulnerable and associated with adverse events. NCL exhibiting thin-cap fibroatheromas as defined by optical coherence tomography, and having a muQFR ≤ 0.80, showed the highest event rate,40 which suggests that imaging can offer additional prognostic information.
PCSK9 inhibitors have shown minimal impact on coronary physiology, despite greatly reducing low-density lipoprotein-cholesterol (LDL-C) levels. A large treatment effect on HIST only,19 minor flow limitation at baseline, and microvascular compensation may account for this finding.13
However, combining alirocumab with HIST resulted in a greater increase in cap thickness of fibroatheromas vs statin monotherapy as assessed by optical coherence tomography.41 Moreover, lower LDL-C levels after an ACS are associated with the occurrence of fewer cardiovascular events.2 Therefore, PCSK9 inhibitor treatment is recommended in patients who do not reach their LDL-C target despite maximum tolerated statin and ezetimibe therapy.2
Limitations
The wide variety of indices to assess coronary physiology has led to a lack of evidence on some of them; similarly, few studies made direct comparisons among such indices.
Our evaluations are mainly based on observational studies with a very different follow-ups.
Angiography-based methods frequently exhibited bias due to their retrospective analysis. Some patients were excluded because of the poor quality of angiographies or anatomic issues, such as ostial lesion or severe vascular tortuosity. Some angiographies were not obtained optimally according to the specific acquisition guide.
CONCLUSIONS
The assessment of functional indices for NCL during the initial procedure for STEMI is not absolutely reliable. This evidence is due to potential variability of the FFR, the iFR, and the QFR outside the acute phase. Although variation was not significant for muQFR, resting Pd/Pa, and vFFR, retrospective and/or limited data limit the generalizability of these findings.
Both the FFR and the iFR showed consistent directions of change. Therefore, during an acute STEMI, the FFR can guide the revascularization of positive NCL, while the iFR can help defer revascularization of negative NCL. A negative FFR with a positive iFR should be reevaluated.
The FFR shows robust data supporting its use in NLC of NSTEMI during the acute phase, meaning that it is a more reliable index for initial ACS procedures.
DATA AVAILABILITY
Search string for Google Scholar: “acute coronary syndrome”|”myocardial infarction” “fractional flow reserve”|FFR| “hyperemic ind”|”resting ind”|iFR|”instantaneous wave-free ratio”| “angiography-based ind”|”angiography-derived ind”|QFR|”quantitative flow ratio”|OFR staged|repeated|later. The remaining search strings are available upon request.
FUNDING
None declared.
ETHICAL CONSIDERATIONS
Ethical committee and patient’s informed consent: not applicable. We followed the SAGER guidelines with respect to possible sex/gender bias.
STATEMENT ON THE USE OF ARTIFICIAL INTELLIGENCE
Microsoft Copilot was used to help edit the English version of the text.
AUTHORS’ CONTRIBUTIONS
F. Vergni designed the work. F. Vergni, S. Buscarini, L. Ciurlanti, and F.L. Gurgoglione contributed to data acquisition (screening, and/or extraction). F. Vergni, and L. Ciurlanti conducted the critical appraisal. F. Vergni, and S. Buscarini contributed to data interpretation. F. Vergni, and F.L. Gurgoglione drafted, edited and reviewed the work. F. Vergni, S. Buscarini, L. Ciurlanti, F.L. Gurgoglione, F. Pellone, and M. Luzi approved the final version for publication.
CONFLICTS OF INTEREST
None declared.
WHAT IS KNOWN ABOUT THE TOPIC?
- The role of physiological assessment of NCL in patients with ACS is still under discussion because its reliability might be flawed due to alterations of both the hyperemic and resting flow in the acute phase.
WHAT DOES THIS STUDY ADD?
- In NSTEACS, it is appropriate to use the FFR for the acute evaluation of NCL. Regarding STEMI, a hybrid approach with both acute FFR and iFR can be considered, with delayed reassessment for doubtful NCL.
SUPPLEMENTARY DATA
REFERENCES
1. Benatti G, Gragnano F, Vignali L, CalabròP, Gurgoglione FL, Niccoli G. Timing and modality of complete revascularization in patients presenting with ST-segment elevation myocardial infarction and multivessel coronary artery disease. Int J Cardiol. 2023;380:6-11.
2. Byrne RA, Rossello X, Coughlan JJ, et al. 2023 ESC Guidelines for the management of acute coronary syndromes. Eur Heart J. 2023;44:3720-3826. Published correction appears in Eur Heart J. 2024;45:1145.
3. Koo BK, Hwang D, Park S, et al. Practical Application of Coronary Physiologic Assessment:Asia-Pacific Expert Consensus Document:Part 2. JACC Asia. 2023;3:825-842.
4. Mejía-Rentería H, Lee JM, van der Hoeven NW, et al. Coronary Microcirculation Downstream Non-Infarct-Related Arteries in the Subacute Phase of Myocardial Infarction:Implications for Physiology-Guided Revascularization. J Am Heart Assoc. 2019;8:011534.
5. Takenaka H, Okamura T, Miyazaki Y, et al. Serial changes in the quantitative flow ratio in patients with intermediate residual stenosis after percutaneous coronary intervention. Heart Vessels. 2022;37:363-373.
6. Cardiovascular Research Foundation. Conference News. Available at: https://www.tctmd.com. Accessed 30 Mar 2025.
7. Clinical Trial Results. Slide Library. Available at: https://clinicaltrialresults.org. Accessed 30 Mar 2025.
8. Page MJ, McKenzie JE, Bossuyt PM, et al. The PRISMA 2020 statement:an updated guideline for reporting systematic reviews. BMJ. 2021;372:71.
9. Moola S, Munn Z, Tufanaru C, et al. Chapter 7:systematic reviews of etiology and risk. In:Aromataris E, Munn Z, editors. JBI Manual for Evidence Synthesis. Adelaide:JBI;2020.
10. Barker TH, Habibi N, Aromataris E, et al. The revised JBI critical appraisal tool for the assessment of risk of bias for quasi-experimental studies. JBI Evid Synth. 2024;22:378-388.
11. Barker TH, Stone JC, Sears K, et al. The revised JBI critical appraisal tool for the assessment of risk of bias for randomized controlled trials. JBI Evid Synth. 2023;21:494-506.
12. Wan X, Wang W, Liu J, Tong T. Estimating the sample mean and standard deviation from the sample size, median, range and/or interquartile range. BMC Med Res Methodol. 2014;14:135.
13. Bär S, Kavaliauskaite R, Otsuka T, et al. Impact of alirocumab on plaque regression and haemodynamics of non-culprit arteries in patients with acute myocardial infarction:a prespecified substudy of the PACMAN-AMI trial. EuroIntervention. 2023;19:286-296.
14. Cortés C, Rodríguez-Gabella T, Gutiérrez H, et al. Quantitative flow ratio in myocardial infarction for the evaluation of non-infarct-related arteries. The QIMERA pilot study. REC Interv Cardiol. 2019;1:13-20.
15. Erbay A, Penzel L, Abdelwahed YS, et al. Feasibility and diagnostic reliability of quantitative flow ratio in the assessment of non-culprit lesions in acute coronary syndrome. Int J Cardiovasc Imaging. 2021;37:1815-1823.
16. Hou S, Zhu X, Zhao Q, et al. Quantitative flow ratio-guided staged percutaneous coronary intervention in patients with ST-segment elevation myocardial infarction. Heliyon. 2024;10:39335.
17. Huang J, Groenland FTW, Scoccia A, et al. Acute-setting vs. -setting vessel fractional flow reserve of intermediate non-culprit lesions in patients with ST-segment elevation myocardial infarction (FAST STAGED study). Int J Cardiol Heart Vasc. 2023;45:101192.
18. Kirigaya H, Okada K, Hibi K, et al. Diagnostic performance and limitation of quantitative flow ratio for functional assessment of intermediate coronary stenosis. J Cardiol. 2021;77:492-499.
19. Mensink F, Los J, van Geuns RJ. Functional and morphological changes of significant non-culprit coronary artery stenosis by extensive LDL-C reduction with PCSK9 inhibitors. Results of the randomized, placebo-controlled FITTER trial. In:ESC Congress 2024;2024 30 August - 2 September;London, United Kingdom. Available at: https://clinicaltrialresults.org/slide-library/.
20. Musto C, De Felice F, Rigattieri S, et al. Instantaneous wave-free ratio and fractional flow reserve for the assessment of nonculprit lesions during the index procedure in patients with ST-segment elevation myocardial infarction:The WAVE study. Am Heart J. 2017;193:63-69.
21. Ntalianis A, Sels JW, Davidavicius G, et al. Fractional flow reserve for the assessment of nonculprit coronary artery stenoses in patients with acute myocardial infarction. JACC Cardiovasc Interv. 2010;3:1274-1281.
22. Sejr-Hansen M, Westra J, Thim T, et al. Quantitative flow ratio for immediate assessment of nonculprit lesions in patients with ST-segment elevation myocardial infarction-An iSTemI substudy. Catheter Cardiovasc Interv. 2019;94:686-692.
23. Shukla A, Dwivedi SK, Chandra S, et al. Reliability of Fractional Flow Reserve in Non-Infarct-Related Arteries in ST-Segment Elevation Myocardial Infarction Patients Undergoing a Pharmaco-Invasive Approach. Cureus. 2024;16:52668.
24. Thim T, Götberg M, Fröbert O, et al. Nonculprit Stenosis Evaluation Using Instantaneous Wave-Free Ratio in Patients With ST-Segment Elevation Myocardial Infarction. JACC Cardiovasc Interv. 2017;10:2528-2535.
25. der Hoeven NW, Janssens GN, de Waard GA, et al. Temporal Changes in Coronary Hyperemic and Resting Hemodynamic Indices in Nonculprit Vessels of Patients With ST-Segment Elevation Myocardial Infarction. JAMA Cardiol. 2019;4:736-744.
26. Wang L, Travieso A, van der Hoeven N, et al. Improved Nonculprit Stenosis Assessment in Patients With ST-Segment Elevation Myocardial Infarction Using Quantitative Flow Ratio. JACC Cardiovasc Interv. 2023;16:1828-1830.
27. Zhao Q, Sun S, Zhou F, Yue J, Luo X, Qu X. The Inhibition of Evolocumab on Non-Infarct-Related Artery Disease in Patients with ST-Elevation Myocardial Infarction. Int J Gen Med. 2023;16:2771-2781.
28. Barauskas M, Žiubryte·G, Jodka N, Unikas R. Quantitative Flow Ratio for Assessment of Non-Culprit Coronary Artery Lesions During Percutaneous Coronary Intervention (PCI) in 79 Patients Diagnosed with ST-Elevation Myocardial Infarction (STemI):A Study from a Single Center in Lithuania. Med Sci Monit. 2023;29:939360.
29. Jo YS, Moon H, Park K. Different Microcirculation Response Between Culprit and Non-Culprit Vessels in Patients With Acute Coronary Syndrome. J Am Heart Assoc. 2020;9:015507.
30. Li X, Mi L, Duan J, Tao L, Xu X, Wang G. Murray law-based quantitative flow ratio for assessment of nonculprit lesions in patients with ST-segment elevation myocardial infarction. Cardiol J. 2024;31:522-527.
31. Park K, Cho YR, Park JS, Park TH, Kim MH, Kim YD. Comparison of the Effects of Ticagrelor and Clopidogrel on Microvascular Dysfunction in Patients With Acute Coronary Syndrome Using Invasive Physiologic Indices. Circ Cardiovasc Interv. 2019;12:008105.
32. Spitaleri G, Tebaldi M, Biscaglia S, et al. Quantitative Flow Ratio Identifies Nonculprit Coronary Lesions Requiring Revascularization in Patients With ST-Segment-Elevation Myocardial Infarction and Multivessel Disease. Circ Cardiovasc Interv. 2018;11:006023.
33. Mensink FB, Los J, Oemrawsingh RM, et al. Functional and morphological improvement of significant non-culprit coronary artery stenosis by LDL-C reduction with a PCSK9 antibody:Rationale and design of the randomized FITTER trial. Heliyon. 2024;10:38077.
34. Biscaglia S, Guiducci V, Escaned J, et al. Complete or Culprit-Only PCI in Older Patients with Myocardial Infarction. N Engl J Med. 2023;389:889-898.
35. Lee JM, Kim HK, Park KH, et al. Fractional flow reserve versus angiography-guided strategy in acute myocardial infarction with multivessel disease:a randomized trial. Eur Heart J. 2023;44:473-484.
36. Böhm F, Mogensen B, Engstrøm T, et al. FFR-Guided Complete or Culprit-Only PCI in Patients with Myocardial Infarction. N Engl J Med. 2024;390:1481-1492.
37. Smits PC, Abdel-Wahab M, Neumann FJ, et al. Fractional Flow Reserve-Guided Multivessel Angioplasty in Myocardial Infarction. N Engl J Med. 2017;376:1234-1244.
38. Engstrøm T, Kelbæk H, Helqvist S, et al. Complete revascularisation versus treatment of the culprit lesion only in patients with ST-segment elevation myocardial infarction and multivessel disease (DANAMI-3—PRIMULTI):an open-label, randomised controlled trial. Lancet. 2015;386:665-671.
39. Puymirat E, Cayla G, Simon T, et al. Multivessel PCI Guided by FFR or Angiography for Myocardial Infarction. N Engl J Med. 2021;385:297-308.
40. Xu X, Fang C, Jiang S, et al. Functional or anatomical assessment of non-culprit lesions in acute myocardial infarction. EuroIntervention. 2025;21:217-228.
41. Räber L, Ueki Y, Otsuka T, et al. Effect of Alirocumab Added to High-Intensity Statin Therapy on Coronary Atherosclerosis in Patients With Acute Myocardial Infarction:The PACMAN-AMI Randomized Clinical Trial. JAMA. 2022;327:1771-1781.

ABSTRACT
Introduction and objectives: The use of coronary physiology is essential to guide revascularization in patients with stable coronary artery disease. However, some patients without significant angiographic coronary artery disease will experience cardiovascular events at the follow-up. This study aims to determine the prognostic value of the global plaque volume (GPV) in patients with stable coronary artery disease without functionally significant lesions at a 5-year follow-up.
Methods: We conducted a multicenter, observational, and retrospective cohort study with a 5-year follow-up. A total of 277 patients without significant coronary artery disease treated with coronary angiography in 2015 due to suspected stable coronary artery disease were included in the study. The 3 coronary territories were assessed using quantitative flow ratio, calculating the GPV by determining the difference between the luminal volume and the vessel theoretical reference volume.
Results: The mean GPV was 170.5 mm3. A total of 116 patients (42.7%) experienced major adverse cardiovascular events (MACE) at the follow-up, including cardiac death (11%), myocardial infarction (2.6%), and unexpected hospital admissions (38.1%). Patients with MACE had a significantly higher GPV (231.6 mm3 vs 111.8 mm3; P < .001). The optimal GPV cut-off point for predicting events was 44 mm3. Furthermore, in the multivariate analysis conducted, plaque volume, diabetes, hypertension, age, dyslipidemia, smoking, age, and GPV > 44 mm3 turned out to be independent predictors of MACE.
Conclusions: GPV, calculated from the three-dimensional reconstruction of the coronary tree, is an independent predictor of events in patients with stable coronary artery disease without significant lesions. A GPV > 44 mm3 is an optimal cut-off point for predicting events.
Keywords: Coronary artery disease. Coronary atherosclerosis. Coronary angiography. Global plaque volume. Coronary physiology. Quantitative flow ratio.
RESUMEN
Introducción y objetivos: La fisiología coronaria es fundamental para guiar la revascularización en los pacientes con enfermedad coronaria estable. Sin embargo, algunos pacientes sin enfermedad coronaria significativa en la angiografía presentarán eventos cardiovasculares posteriormente. Este estudio pretende determinar el valor pronóstico del volumen global de placa (VGP) en pacientes con enfermedad coronaria estable sin lesiones funcionalmente significativas durante 5 años de seguimiento.
Métodos: Se realizó un estudio observacional multicéntrico de cohortes retrospectivo con seguimiento a 5 años, que incluyó 277 pacientes sin enfermedad coronaria significativa intervenidos mediante coronariografía en 2015 por sospecha de enfermedad coronaria estable. Se evaluaron los 3 territorios coronarios mediante el cociente de flujo cuantitativo, calculando el VGP como la diferencia entre el volumen luminal y el volumen teórico de referencia del vaso.
Resultados: El VGP medio fue de 170,5 mm3. Durante el seguimiento, 116 pacientes (42,7%) presentaron eventos cardiovasculares mayores (MACE), que incluyeron muerte de causa cardiaca (11%), infarto de miocardio (2,6%) y hospitalizaciones no programadas (38,1%). Los pacientes con MACE tenían un VGP significativamente mayor (231,6 frente a 111,8 mm3, p < 0,001). El punto de corte óptimo del VGP para predecir eventos fue de 44 mm3. En el análisis multivariado, que consideró volumen de placa, diabetes, hipertensión, edad, dislipemia y tabaquismo, la edad y un VGP > 44 mm3 fueron predictores independientes de MACE.
Conclusiones: El VGP calculado mediante reconstrucción tridimensional del árbol coronario es un predictor independiente de eventos en pacientes con enfermedad coronaria estable sin lesiones significativas. Un VGP > 44 mm3 es el punto de corte óptimo para predecir eventos.
Palabras clave: Enfermedad coronaria. Ateroesclerosis coronaria. Angiografía coronaria. Volumen global de placa. Fisiología coronaria. Cociente de flujo cuantitativo.
Abbreviations
GPV: global plaque volume. MACE: major adverse cardiovascular events. QFR: quantitative flow ratio. ROC: receiver operating characteristic curve.
INTRODUCTION
Coronary artery disease is the leading cause of mortality worldwide.1 Despite the safety involved in deferring invasive treatment in patients with stable coronary artery disease without functionally significant lesions,2 a percentage of patients experience cardiovascular events at the long-term follow-up.3 It has been reported that cardiovascular events not only depend on the degree of coronary obstruction assessed by intracoronary physiology4-5 but also on the global atherosclerotic burden and its vulnerability assessed by intracoronary imaging modalities.6-8
The new era of coronary physiology is based on predicting fractional flow reserve by reconstructing the coronary tree using angiography and computational fluid dynamics.9-10 Estimating quantitative flow ratio (QFR) is the most validated method of the ones currently available.
QFR—which predicts fractional flow reserve10-11—has proven to be a better tool than angiography alone to guide the need for lesion revascularization12 and shown long-term prognostic value13. Furthermore, it provides quantitative information out of the 3D reconstruction of the coronary tree, including minimum diameter and area, reference diameters, luminal volume, and atherosclerotic plaque volume in the studied vessel. However, the prognostic value of this quantitative analysis has not been sufficiently studied.
The main aim of this study was to determine the prognostic value of global plaque volume (GPV) in patients with stable coronary artery disease without functionally significant lesions at a 5-year follow-up.
METHODS
We conducted a retrospective observational study on a cohort of patients from 6 tertiary referral centers.
Study population
Patients who underwent coronary angiography from January through December 2015 for suspected stable coronary artery disease were included. Each participant center retrospectively enrolled all patients who underwent coronary angiography for suspected stable coronary artery disease and met the inclusion criteria. Patients with chronic total coronary occlusions, prior coronary artery bypass graft surgery, or inadequate angiographic quality for analysis were excluded. Additionally, patients whose angiographic analysis revealed a positive QFR study (< 0.80) in any coronary territory were excluded. The principal investigator conducted a retrospective follow-up at each center within the next 5 years following the index procedure. Baseline and procedural characteristics, and events at the follow-up were collected by local investigators. The study fully complied the good clinical practice principles and regulations set forth in the Declaration of Helsinki for research with human subjects. The study protocol was approved by the ethics committee of the reference hospital (Hospital Clínico Universitario de Valladolid) and the institutional review boards, including informed consent obtained from participants or, alternatively, approval for retrospective data analysis under ethical committee supervision.
Angiographic analysis
A blinded angiographic analysis of diagnostic coronary angiograms was performed by trained analysts at a centralized imaging unit (Icicorelab, Valladolid) using specialized software (QAngio XA 3D QFR, Medis Medical Imaging System, The Netherlands). A 3D reconstruction of the 3 major coronary vessels was performed using 2 different projections with > 25° of separation. For the right and left circumflex coronary arteries, the proximal marker was manually placed at the vessel ostium, while for the left anterior descending coronary artery, it was placed at the left main coronary artery ostium. The distal marker was placed at the end of the coronary artery. Plaque volume was estimated by calculating the difference between the theoretical reference vessel volume in the absence of atherosclerotic disease and the estimated vessel volume in angiography using QFR software via quantitative analysis. Reference diameters, minimum diameter, and minimum area were obtained for each vessel. Considering contrast flow through the coronary tree, QFR was calculated according to FAVOR II standards for the physiological significance of coronary lesions. Patients with functionally significant disease (QFR < 0.80) were excluded.
Statistical analysis
Categorical variables are expressed as totals and percentages, and continuous ones as means and standard deviations. GPV was estimated as the sum of plaque volume across 3 coronary territories.
The primary endpoint—major adverse cardiovascular events (MACE)—was a composite of cardiac death, acute myocardial infarction, or all-cause unplanned hospital admission.
An optimal GPV cutoff as a predictor of MACE was determined using the receiver operating characteristic (ROC) curve as the value with the maximum Youden index. Multivariate logistic regression models were used to calculate the odds ratio and 95% confidence interval as independent predictors for MACE. Variables with P < .20 in the univariate analysis were included in the multivariate model as covariates.
Event-free survival was compared using Kaplan-Meier and Mantel-Haenszel analyses. All probability values were two-tailed, and P < .05 was considered statistically significant. Statistical analysis was performed using Stata (16.1, StataCorp, College Station, United States).
RESULTS
Descriptive population analysis
A total of 803 patients were evaluated for inclusion in the registry, 122 of whom (15.2%) were excluded due to chronic occlusions in ≥ 1 coronary territory, 17 (2.12%) due to previous surgical myocardial revascularization, and 159 (19.2%) due to inadequate angiographic analysis in, at least, 1 coronary territory. Among the remaining patients, 228 (45.1%) had significant coronary artery disease (QFR < 0.80) in, at least, 1 coronary territory, which left a final cohort of 277 patients. Patient flowchart is shown in figure 1.

Figure 1. Flowchart of the patient selection process for inclusion in the study. CABG, coronary artery bypass graft; CTO, chronic total coronary occlusion; QFR, quantitative flow ratio.
The mean age of the population was 65.8 years (most were hypertensive [74.4%] men [66.1%]). Table 1 illustrates the baseline characteristics of the population. The median follow-up was 69 months, during which time 5 patients were lost to follow-up.
Table 1. Baseline characteristics of the included population
| Variable | n/mean | Proportion/SD |
|---|---|---|
| Female Sex | 94 | 33.9% |
| Hypertension | 206 | 74.3% |
| Diabetes mellitus | 106 | 38.2% |
| Dyslipidemia | 188 | 67.9% |
| Smoking | 121 | 43.7% |
| Chronic kidney disease | 21 | 7.6% |
| Peripheral arterial disease | 14 | 5.1% |
| Previous ischemic heart disease | 105 | 37.9% |
| Age (years) | 65.8 | 12.2 |
| Weight (kg) | 78.0 | 15.0 |
| Height (cm) | 156.2 | 36.8 |
| Left ventricular ejection fraction (%) | 57.4 | 9.3 |
|
SD, standard deviation. |
||
Angiographic analysis
Mean plaque volume in the study population was 170.5 mm3 (± 16.5); mean QFR was 0.95. Table 2 illustrates the overall means from the angiographic analysis according to the coronary territory studied. Plaque volume was independently analyzed for each coronary territory and was significantly higher in the right (243 mm3) vs the left anterior descending (161.4 mm3) and left circumflex coronary arteries (172.9 mm3). Data on this analysis by coronary territories are shown in table 1 and figure 1 of the supplementary data.
Table 2. Characteristics of the angiographic analysis performed in the 3 coronary territories using quantitative flow ratio
| Variable | Mean | SD | 95%CI |
|---|---|---|---|
| QFR | 0.95 | 0.37 | 0.95-0.96 |
| Length | 76.99 | 13.21 | 75.22-78.77 |
| Proximal diameter | 3.18 | 0.47 | 3.11-3.24 |
| Distal diameter | 1.99 | 0.34 | 1.95-2.04 |
| Reference diameter | 2.69 | 0.42 | 2.58-2.70 |
| Minimum lumen diameter | 1.76 | 0.34 | 1.72-1.81 |
| Percent diameter stenosis | 33.81 | 6.44 | 32.95-34.68 |
| Stenosis area (%) | 38.72 | 9.59 | 37.43-40.01 |
| Minimum lumen area | 3.53 | 1.30 | 3.35-3.70 |
| Lumen volume | 295.5 | 242.25 | 262.83-328.12 |
| Plaque volume | 170.54 | 240.24 | 138.17-202.91 |
|
SD, standard deviation; 95%CI, 95% confidence interval; QFR, quantitative flow ratio. |
|||
Prognostic value of global plaque volume
The primary event (MACE) occurred in 116 patients, which amounts to 42.7% of the cohort at the follow-up. Among these patients, 11% died, 2.6% suffered an acute myocardial infarction, and 38.1% required unplanned hospitalization. Patients who developed MACE had a significantly higher GPV (231.6 vs 111.8 mm3; P < .001), as well as those with a higher mortality rate (255.2 mm3 vs 154.3 mm3; P = .04) or unplanned hospitalizations (235.0 mm3 vs 125.4 mm3; P < .001). However, there were no significant differences in patients who experienced acute myocardial infarction (235.1 mm3 vs 169.3 mm3; P = .51).
The optimal GPV cutoff to predict events was set at 44 mm3 based on ROC curve analysis (sensitivity, 64%; specificity, 65.8%; LR+, 1.9; LR–, 0.6).
Table 3 illustrates the study of the main determinants of the primary event. Variables with a significance level of P < .10 were included in the multivariate analysis. In the final model, age and GPV were independent predictors. A GPV > 44 mm3 was associated with a 2.8-fold higher risk of events at the follow-up (figure 2).
Table 3. Uni- and multivariate analysis of determinants of the main event
| Determinants of the main event | Univariate analysis | Multivariate analysis | ||
|---|---|---|---|---|
| OR | 95%CI | OR | 95%CI | |
| Sex, female | 1.09 | 0.66-1.81 | ||
| Age* | 1.03 | 1.01-1.10 | 1.03 | 1.00-1.07 |
| Hypertension* | 2.26 | 1.26-4.07 | 1.70 | 0.82-3.53 |
| Diabetes mellitus | 1.18 | 0.72-1.93 | ||
| Dyslipidemia | 1.04 | 0.62-1.73 | ||
| Smoking | 1.01 | 0.72-1.42 | ||
| Chronic kidney disease | 1.00 | 0.41-2.46 | ||
| Peripheral arterial disease | 1.37 | 0.47-4.01 | ||
| Previous ischemic heart disease* | 1.52 | 0.93-2.50 | 1.46 | 0.80-2.68 |
| LVEF | 0.98 | 0.96-1.01 | ||
| GPV (> 44 mm3)* | 1.93 | 1.17-3.18 | 2.80 | 1.51-5.21 |
| Reference vessel diameter* | 2.20 | 1.12-4.35 | 1.62 | 0.75-3.50 |
|
* P values < .10 were included in the multivariate analysis. 95%CI, 95% confidence interval; GPV, global plaque volume; LVEF, left ventricular ejection fraction; OR, odds ratio. |
||||

Figure 2. Kaplan-Meier curve showing the patients’ event-free survival based on their global plaque volume.
DISCUSSION
The main finding of this study is that GPV quantification emerged as an independent prognostic factor in patients without functionally significant coronary artery disease, which demonstrated that those with a higher GPV experienced more events at the follow-up. The optimal GPV cutoff for event prediction was set at 44 mm3. This study emphasizes the importance of anatomically characterizing coronary arteries without significant lesions.
Despite the absence of significant coronary artery obstructions, some patients still experience events during follow-up.14 In patients with a negative QFR functional study, it has been reported that the 5-year rate of events—cardiac death, target vessel myocardial infarction—is 11.6%,3 similar to our findings, where mortality rate was 11% and acute myocardial infarction occurred in 2.6% of patients. Determining the difference between the actual vessel diameter and the estimated diameter obtained through 3D reconstruction from QFR-based angiography has been used in other studies.15 This estimation—previously derived from coronary computed tomography16-17—has demonstrated the prognostic significance of plaque volume differences between normal and non-obstructive coronary arteries. These differences have also been confirmed using invasive imaging modalities such as intravascular ultrasound.18 Although angiography-derived percent luminal stenosis shows poor concordance with myocardial ischemia,19 a greater degree of coronary stenosis (percent diameter stenosis > 50%) is associated with a higher event rate at the 2-year follow-up in patients without functionally significant coronary lesions.20 The present study takes a step further into the minimally invasive characterization of atherosclerotic burden using easy-to-implement 3D coronary tree reconstruction technology as an independent prognostic factor in patients without functionally significant coronary lesions. In this regard, this study is consistent with recent studies which demonstrated that subclinical atherosclerosis burden—measured by vascular ultrasound for carotid plaque quantification and computed tomography for coronary calcium scoring—in asymptomatic individuals is independently associated with all-cause mortality.21
Based on these findings, GPV measurement enables the identification of patients who, despite having no significant coronary lesions, are at risk of developing events within the next 5 years, allowing for intensified treatment and cardiovascular risk factor control. However, this study has limitations, including its retrospective design for patient inclusion and recruitment, the use of indirect methods—such as QFR—to estimate plaque volume, and the inability of this method to describe plaque characteristics, or potential lipid plaque vulnerability. Of note, the estimated plaque volume in each coronary artery was not specifically correlated with events in that territory but rather with overall adverse cardiovascular events. Therefore, further studies are needed to confirm or refute this hypothesis.
CONCLUSIONS
Plaque volume, calculated by 3D coronary tree reconstruction, is an independent predictor of events in patients with suspected stable ischemic heart disease without significant coronary artery disease. The optimal GPV cutoff for event prediction is 44 mm3.
FUNDING
C. Cortés received funding through the Río Hortega contract CM22/00168 and Miguel Servet CP24/00128 from Instituto de Salud Carlos III (Madrid, Spain).
ETHICAL CONSIDERATIONS
The present study was conducted in full compliance with clinical practice guidelines set forth in the Declaration of Helsinki for clinical research and was approved by the ethics committees of the reference hospital (Hospital Clínico Universitario de Valladolid) and other participant centers. Possible sex- and gender-related biases were also considered.
DECLARATION ON THE USE OF ARTIFICIAL INTELLIGENCE
No artificial intelligence was used in the writing of this text.
AUTHORS’ CONTRIBUTIONS
C. Cortés and J. Ruiz-Ruiz participated in study design, data analysis, manuscript drafting, and critical review. C. Fernández and M. García participated in data collection and result analysis. F. Rivero and R. López-Palop assisted in data collection. S. Blasco and A. Freites contributed to statistical analysis. L. Scorpiglione and M. Rosario Ortas Nadal collaborated in data interpretation. O. Jiménez participated in manuscript preparation and initial review. J.A. San Román Calvar and I.J. Amat-Santos conducted the final review and approved the version for publication.
CONFLICTS OF INTEREST
None declared.
WHAT IS KNOWN ABOUT THE TOPIC?
- Global plaque volume has already been identified as an independent risk factor for the occurrence of new coronary events at the follow-up of patients without significant coronary lesions. However, this risk was determined using coronary computed tomography and imaging modalities such as intravascular ultrasound.
WHAT DOES THIS STUDY ADD?
- This article is the first study to only use the patient’s own angiography and minimally invasive coronary physiology techniques, such as quantitative flow ratio to determine plaque volume and its relationship with major cardiovascular events at a 5-year follow-up in patients without significant coronary artery disease. This approach simplifies the implementation of this technique and enhances prevention strategies for patients at higher risk of cardiovascular events.
SUPPLEMENTARY DATA
REFERENCES
1. Laslett LJ, Alagona PJ, Clark BA 3rd, et al. The worldwide environment of cardiovascular disease:prevalence, diagnosis, therapy, and policy issues:a report from the American College of Cardiology. J Am Coll Cardiol. 2012;60:S1-49.
2. Zimmermann FM, Ferrara A, Johnson NP, et al. Deferral vs. of percutaneous coronary intervention of functionally non-significant coronary stenosis:15-year follow-up of the DEFER trial. Eur Heart J. 2015;36:3182-3188.
3. Kuramitsu S, Matsuo H, Shinozaki T, et al. Five-Year Outcomes After Fractional Flow Reserve-Based Deferral of Revascularization in Chronic Coronary Syndrome:Final Results From the J-CONFIRM Registry. Circ Cardiovasc Interv. 2022;15:E011387.
4. De Bruyne B, Pijls NHJ, Kalesan B, et al. Fractional flow reserve-guided PCI versus medical therapy in stable coronary disease. N Engl J Med. 2012;367:991-1001.
5. Ciccarelli G, Barbato E, Toth GG, et al. Angiography versus hemodynamics to predict the natural history of coronary stenoses:Fractional flow reserve versus angiography in multivessel evaluation 2 substudy. Circulation. 2018;137:1475-1485.
6. Mortensen MB, Dzaye O, Steffensen FH, et al. Impact of Plaque Burden Versus Stenosis on Ischemic Events in Patients With Coronary Atherosclerosis. J Am Coll Cardiol. 2020;76:2803-2813.
7. Shan P, Mintz GS, McPherson JA, et al. Usefulness of Coronary Atheroma Burden to Predict Cardiovascular Events in Patients Presenting With Acute Coronary Syndromes (from the PROSPECT Study). Am J Cardiol. 2015;116:1672-1677.
8. Prati F, Romagnoli E, Gatto L, et al. Relationship between coronary plaque morphology of the left anterior descending artery and 12 months clinical outcome:the CLIMA study. Eur Heart J. 2020;41:383-391.
9. Tu S, Westra J, Yang J, et al. Diagnostic Accuracy of Fast Computational Approaches to Derive Fractional Flow Reserve From Diagnostic Coronary Angiography:The International Multicenter FAVOR Pilot Study. JACC Cardiovasc Interv. 2016;9:2024-2035.
10. Westra J, Andersen BK, Campo G, et al. Diagnostic Performance of In?Procedure Angiography?Derived Quantitative Flow Reserve Compared to Pressure?Derived Fractional Flow Reserve:The FAVOR II Europe?Japan Study. J Am Heart Assoc. 2018;7:009603.
11. Cortés C, Carrasco-Moraleja M, Aparisi A, et al. Quantitative flow ratio —Meta-analysis and systematic review. Catheter Cardiovasc Interv. 2021;97:807-814.
12. Xu B, Tu S, Song L, et al. Angiographic quantitative flow ratio-guided coronary intervention (FAVOR III China):a multicentre, randomised, sham-controlled trial. Lancet. 2021;398:2149-2159.
13. Cortés C, Fernández-Corredoira PM, Liu L, et al. Long-term prognostic value of quantitative-flow-ratio-concordant revascularization in stable coronary artery disease. Int J Cardiol. 2023;389:131176.
14. Wang TKM, Oh THT, Samaranayake CB, et al. The utility of a “non-significant“coronary angiogram. Int J Clin Pract. 2015;69:1465-1472.
15. Kolozsvári R, Tar B, Lugosi P, et al. Plaque volume derived from three-dimensional reconstruction of coronary angiography predicts the fractional flow reserve. Int J Cardiol. 2012;160:140-144.
16. Huang FY, Huang BT, Lv WY, et al. The Prognosis of Patients With Nonobstructive Coronary Artery Disease Versus Normal Arteries Determined by Invasive Coronary Angiography or Computed Tomography Coronary Angiography:A Systematic Review. Medicine (Baltimore). 2016;95:3117.
17. Khajouei AS, Adibi A, Maghsodi Z, Nejati M, Behjati M. Prognostic value of normal and non-obstructive coronary artery disease based on CT angiography findings. A 12 month follow up study. J Cardiovasc Thorac Res. 2019;11:318-321.
18. Lee JM, Choi KH, Koo BK, et al. Prognostic Implications of Plaque Characteristics and Stenosis Severity in Patients With Coronary Artery Disease. J Am Coll Cardiol. 2019;73:2413-2424.
19. Tebaldi M, Biscaglia S, Fineschi M, et al. Evolving Routine Standards in Invasive Hemodynamic Assessment of Coronary Stenosis. JACC Cardiovasc Interv. 2018;11:1482-1491.
20. Ciccarelli G, Barbato E, Toth GG, et al. Angiography versus hemodynamics to predict the natural history of coronary stenoses:Fractional flow reserve versus angiography in multivessel evaluation 2 substudy. Circulation. 2018;137:1475-1485.
21. Fuster V, García-Álvarez A, Devesa A, et al. Influence of Subclinical Atherosclerosis Burden and Progression on Mortality. J Am Coll Cardiol. 2024;84:1391-1403.

ABSTRACT
Introduction and objectives: There is limited data on the impact of the culprit vessel on very long-term outcomes after ST-elevation myocardial infarction (STEMI). The aim was to analyze the impact of the left anterior descending coronary artery (LAD) as the culprit vessel of STEMI on very long-term outcomes.
Methods: We analyzed patients included in the EXAMINATION-EXTEND study (NCT04462315) treated with everolimus-eluting stents or bare-metal stents after STEMI (1498 patients) and stratified according to the culprit vessel (LAD vs other vessels). The primary endpoint was the patient-oriented composite endpoint (POCE), including all-cause mortality, myocardial infarction (MI) or revascularization at 10 years. Secondary endpoints were individual components of POCE, device-oriented composite endpoint and its individual components and stent thrombosis. We performed landmark analyses at 1 and 5 years. All endpoints were adjusted with multivariable Cox regression models.
Results: The LAD was the culprit vessel in 631 (42%) out of 1498 patients. The LAD-STEMI group had more smokers, advanced Killip class and worse left ventricular ejection fraction. Conversely, non-LAD-STEMI group showed more peripheral vascular disease, previous MI, or previous PCI. At 10 years, no differences were observed between groups regarding POCE (34.9% vs 35.4%; adjusted hazard ratio [HR], 0.95; 95% confidence interval [95%CI], 0.79-1.13; P = .56) or other endpoints. The all-cause mortality rate was higher in the LAD-STEMI group (P = .041) at 1-year.
Conclusions: In a contemporary cohort of STEMI patients, there were no differences in POCE between LAD as the STEMI-related culprit vessel and other vessels at 10 years follow-up. However, all-cause mortality was more common in the LAD-STEMI group within the first year after STEMI.
Keywords: Acute myocardial infarction. STEMI. Angiography. Coronary. Percutaneous coronary intervention.
RESUMEN
Introducción y objetivos: Existen datos limitados sobre el impacto a muy largo plazo del vaso culpable después de un infarto de miocardio con elevación del segmento ST (IAMCEST). El objetivo fue analizar el efecto de la arteria descendente anterior (DA) como vaso culpable en el IAMCEST en los resultados a muy largo plazo.
Métodos: Se analizaron los pacientes incluidos en el estudio EXAMINATION-EXTEND (NCT04462315) que recibieron stents liberadores de everolimus o stents metálicos después de un IAMCEST (1.498 pacientes) y se estratificaron según el vaso culpable (DA frente a otros vasos). El objetivo primario fue el objetivo combinado orientado al paciente (POCE) que incluyó muerte por cualquier causa, infarto agudo de miocardio (IAM) o revascularización a los 10 años. Los objetivos secundarios fueron los componentes individuales del POCE, el evento compuesto orientado al dispositivo y sus componentes individuales, así como la trombosis del stent. Se realizaron análisis de puntos de referencia a 1 y 5 años. Todos los objetivos fueron ajustados mediante modelos de regresión de Cox multivariantes.
Resultados: De los 1.498 pacientes, la DA fue el vaso culpable en 631 (42%). El grupo IAMCEST-DA mostró mayor proporción de fumadores, una clase Killip más avanzada y una peor fracción de eyección del ventrículo izquierdo. En cambio, el grupo sin IAMCEST-DA mostró mayor prevalencia de enfermedad vascular periférica, IAM previo y angioplastia coronaria previa. A los 10 años no se observaron diferencias entre los grupos para el POCE (34,9 frente a 35,4%; hazard ratio, 0,95; intervalo de confianza del 95%, 0,79-1,13; p = 0,56) ni para otros objetivos. Hubo una mayor mortalidad por cualquier causa en el grupo IAMCEST-DA (p = 0,041) al primer año.
Conclusiones: En una cohorte contemporánea de pacientes con IAMCEST no hubo diferencias en cuanto al POCE entre la DA como vaso culpable en el IAMCEST y los otros vasos a los 10 años de seguimiento. Sin embargo, en el primer año después del IAMCEST, la mortalidad por cualquier causa fue más común en el grupo IAMCEST-DA.
Palabras clave: Infarto agudo de miocardio. IAMCEST. Angiografía. Coronaria. Intervención coronaria percutánea.
Abbreviations
LAD: left anterior descending coronary artery. LVEF: left ventricular ejection fraction. MI: myocardial infarction. PCI: percutaneous coronary intervention. POCE: patient-oriented composite endpoint. STEMI: ST−segment elevation myocardial infarction.
INTRODUCTION
Percutaneous coronary intervention (PCI) is the first-line therapy in patients with ST-segment-elevation myocardial infarction (STEMI).1 The STEMI-related culprit vessel is usually considered as one of the most important prognostic factors in STEMI patients.2,3 This assumption comes from previous studies –conducted in the pre-reperfusion or thrombolysis era– which showed that left anterior descending artery (LAD)-related STEMIs were associated with worse clinical outcomes compared with right coronary (RCA) and left circumflex artery (LCX)-related lesions.4-9
However, in the contemporary era of primary PCI there are limited data about the prognostic impact of LAD as the STEMI-related culprit vessel especially in a very long follow-up.10,11
Therefore, the aim of this study was to investigate the impact of the LAD as the STEMI-related culprit vessel on very long-term clinical outcomes in STEMI patients undergoing primary PCI enrolled in the EXAMINATION-EXTEND study (10-year follow-up of the EXAMINATION trial).
METHODS
Study design and patients
The EXAMINATION trial (NCT00828087) was an all-comer, multicenter, prospective, 1:1 randomized, 2-arm, single-blind, controlled trial conducted at 12 centers across 3 countries to assess the superiority of EES (Xience V) vs BMS (Multilink Vision, Abbott Vascular) in STEMI patients regarding the primary endpoint of all-cause mortality, any myocardial infarction, and any revascularization at 1 year. The study had broad inclusion criteria and few exclusion criteria to ensure an all-comer STEMI population representative of the routine clinical practice. The study outcomes have been reported up to the year 5.12,13 After that, it was reinitiated as the EXAMINATION- EXTEND study to evaluate patient- and device-oriented composite endpoints at 10 years. The latter is registered at ClinicalTrials.gov (NCT04462315) as an investigator-driven extension of follow-up of the EXAMINATION trial. An independent study monitor (ADKNOMA, Barcelona, Spain) verified the adequacy of the extended follow-up and events reported. All events were adjudicated and classified by an independent event adjudication committee blinded to the therapy groups (Barcicore Lab, Barcelona, Spain). The 10-year primary endpoint results of the EXAMINATION-EXTEND study have been previously published.14 For the aim of this study, baseline, procedural characteristics and outcomes were stratified according to the STEMI-related culprit vessel (LAD vs others). All centers participating in the EXAMINATION trial received the approval of their Medical Ethics Committee, and all enrolled patients who had already signed their written informed consent forms. Medical ethics committee approval for EXAMINATION- EXTEND was granted at the institutions of the principal investigators (Hospital Clínic and Hospital Bellvitge, Barcelona, Spain), and the requirement to obtain informed consent to gather information on 10- year events was waived. The study complied with the Declaration of Helsinki.
Study endpoints
The primary endpoint of this study was the patient-oriented composite endpoint of all-cause mortality, any myocardial infarction, or any revascularization at 10 years. Secondary endpoints were each individual components of the primary endpoint, device-oriented composite endpoint (cardiac death, target-vessel myocardial infarction, target lesion revascularization), its individual components and stent thrombosis. Detailed descriptions of the study endpoints and definitions have been published previously.15
Statistical analysis
Continuous variables are expressed as median (interquartile range; IQR), and categorical variables as absolute and relative frequencies (percentages).
Baseline clinical, angiographic, and procedural characteristics were compared between the groups stratified by the STEMI-related artery (LAD vs other vessels) using the Wilcoxon rank sum test, the chi-square, or Fisher’s exact test, where appropriate.
Time-to-event curves for POCE and all-cause death were plotted using the one minus the Kaplan-Meier estimate and the cumulative incidence function for other outcomes. The incidence of events at the follow-up was compared between groups using log-rank or Grey’s test. Landmark analyses were also performed, setting landmark points at 1 and 5 years.
The association between LAD as a STEMI-related culprit vessel and events was analyzed in univariable and multivariable cause-specific Cox regression models. Covariates were added to the multivariable model in 2 blocks. The first model included all clinically relevant baseline characteristics variables with P < .1 in the between-groups comparison (LAD vs other vessels), i.e., sex, smoking status, peripheral vascular disease, previous PCI, previous CABG, previous MI, and Killip class. The second model (expanded adjustment) included both the baseline characteristics and the left ventricular ejection fraction (LVEF) at discharge.
Two-tailed P-value < .05 was considered statistically significant. All statistical analyses were performed using R (R Core Team (2022). R: a language for statistical computing. R Foundation for Statistical Computing, Austria) with the following packages: survival, tidycmprsk, jskm, and gtsummary.
RESULTS
Patient characteristics
In 631 (42%) out of the 1498 STEMI patients included in the EXAMINATION EXTEND trial, the LAD was the culprit vessel (LAD-STEMI group), whereas in 867 patients (58%) it was not (non- LAD-STEMI group). Patients’ inclusion flowchart is shown in figure 1.

Figure 1. Study flowchart. A total of 1498 patients were initially recruited. At 10 years, clinical follow-up was obtained in 95.2% of the patients. LAD, left anterior descending artery; STEMI, ST-elevation myocardial infarction.
LAD-STEMI group had a higher incidence of active smokers, advanced Killip class and more depressed LVEF vs the non-LAD-STEMI group, which, however, exhibited a higher incidence of peripheral vascular disease, previous MI and previous PCI (table 1). Also, although non-statistically significant, the frequency of late comers and bailout PCI was numerically higher in the LAD-STEMI group.
Table 1. Baseline clinical characteristics
| Clinical characteristics | Overall (N = 1498)a | LAD-STEMI (N = 631)a | Non-LAD-STEMI (N = 867)a | |
|---|---|---|---|---|
| 61 [51-71] | 61 [51-71] | 61 [51-70] | .778 | |
| 1,244 (83%) | 512 (81%) | 732 (84%) | .094 | |
| 415 (28%) | 197 (31%) | 218 (25%) | .009 | |
| 655 (44%) | 268 (43%) | 387 (45%) | .419 | |
| 725 (48%) | 307 (49%) | 418 (48%) | .843 | |
| 55 (3.7%) | 14 (2.2%) | 41 (4.7%) | .011 | |
| 31 (2.1%) | 14 (2.2%) | 17 (2.0%) | .726 | |
| 80 (5.3%) | 23 (3.7%) | 57 (6.6%) | .013 | |
| 61 (4.1%) | 18 (2.9%) | 43 (5.0%) | .042 | |
| 10 (0.7%) | 1 (0.2%) | 9 (1.0%) | .052 | |
| .126 | ||||
| 1,268 (85%) | 520 (82%) | 748 (86%) | ||
| 98 (6.5%) | 51 (8.1%) | 47 (5.4%) | ||
| 34 (2.3%) | 14 (2.2%) | 20 (2.3%) | ||
| 97 (6.5%) | 46 (7.3%) | 51 (5.9%) | ||
| < .001 | ||||
| I | 1,337 (90%) | 525 (83%) | 812 (94%) | |
| II | 115 (7.7%) | 76 (12%) | 39 (4.5%) | |
| III | 23 (1.5%) | 20 (3.2%) | 3 (0.3%) | |
| IV | 18 (1.2%) | 8 (1.3%) | 10 (1.2%) | |
| 52 (45, 58) | 46 [40-55] | 55 [50-60] | < .001 | |
| 1.38 (0.70, 3.00) | 1.27 [0.67-3.00] | 1.47 [0.75-3.00] | .353 | |
|
CABG, coronary artery bypass graft; LVEF, left ventricular ejection fraction; PCI, percutaneous coronary intervention. a>Median [interquartile range] or frequency (%). bWilcoxon rank sum test; Pearson’s chi-squared test; Fisher’s exact test. |
||||
Regarding procedural data, LAD-STEMI group received smaller stent diameter (3.12 mm vs 3.26 mm; P = .001) and had a lower incidence of ST-segment resolution than the non-LAD-STEMI group (73%, vs 50%; P = .001) (table 2). The use of GP IIb/IIIa inhibitors was numerically lower in the LAD-STEMI group, although the differences between groups were not statistically significant. Of note, almost half of the patients (46%) with LAD-STEMI had the lesion in the proximal LAD compared with 44% of them who had it in the mid/distal LAD.
Table 2. Angiographic and procedural characteristics
| Procedural characteristics | Overall (N = 1498)a | LAD-related STEMI (N = 631)a | Non-LAD-related STEMI (N = 867)a | |
|---|---|---|---|---|
| N/A | ||||
| LAD | 631 (42) | 631 (100) | 0 (0) | |
| LMCA | 3 (0.2) | 0 (0) | 3 (0.3) | |
| RCA | 650 (43) | 0 (0) | 650 (75) | |
| LCx | 207 (14) | 0 (0) | 207 (24) | |
| SVG | 7 (0.5) | 0 (0) | 7 (0.8) | |
| 188 (13) | 72 (11) | 116 (13) | .256 | |
| 3.9 [2.7-6.8] | 4.0 [2.7-7.3] | 3.9 [2.7-6.3] | .366 | |
| 976 (65) | 405 (64) | 571 (66) | .502 | |
| 785 (52) | 312 (49) | 473 (55) | .051 | |
| 885 (60) | 390 (63) | 495 (59) | .113 | |
| .312 | ||||
| DES | 751 (50) | 326 (52) | 425 (49) | |
| BMS | 747 (50) | 305 (48) | 442 (51) | |
| 1.39 (0.65) | 1.37 (0.63) | 1.40 (0.66) | .428 | |
| 23 (18-35) | 23 (18-33) | 23 (18-35) | .154 | |
| 3.20 (0.45) | 3.12 (0.40) | 3.26 (0.47) | < .001 | |
| 221 (15) | 97 (15) | 124 (14) | .564 | |
| .607 | ||||
| 0 | 26 (1.7) | 9 (1.4) | 17 (2.0) | |
| 1 | 12 (0.8) | 5 (0.8) | 7 (0.8) | |
| 2 | 59 (4.0) | 29 (4.6) | 30 (3.5) | |
| 3 | 1396 (94) | 584 (93) | 812 (94) | |
| 852 (63) | 285 (50) | 567 (73) | < .001 | |
|
BMS, bare metal stent; CABG, coronary artery bypass graft. DES, drug-eluting stent; LAD, left anterior descending coronary artery, LCx, left circumflex artery; LMCA, left main coronary artery; PCI, percutaneous coronary intervention; RCA, right coronary artery; STEMI: ST-segment elevation myocardial infarction; SVG, saphenous venous graft; TIMI, thrombolysis in myocardial infarction. aMedian [interquartile range], mean (standard deviation) or frequency (%). bFisher’s exact test; Pearson’s chi-squared test; Wilcoxon rank sum test. |
||||
Ten-year outcomes
At the 10-year follow-up, POCE did not differ between LAD-STEMI and non-LAD-STEMI group (adjusted HR, 0.95; 95%CI, 0.79-1.13; P = .56) (figure 2). Moreover, no differences were found in terms of each individual component of POCE (all-cause mortality, MI, any revascularization) (figure 3) and other secondary endpoints (figure 1 of the supplementary data). Furthermore, when the expanded adjustment was performed and LVEF was included in the multivariable analysis, there were no inter-group differences between (table 3).

Figure 2. Central illustration. Outcomes of patients with ST-segment elevation myocardial infarction according to the culprit vessel at the 10-year follow-up. LAD, left anterior descending coronary artery; STEMI: ST-segment elevation myocardial infarction; POCE: patient-oriented composite endpoint.

Figure 3. Time-to-event curves for the patient-oriented composite endpoint (A), all-cause mortality (B), myocardial infarction (C), and any revascularization (D) in patients stratified according to the culprit vessel. LAD, left anterior descending coronary artery; MI, myocardial infarction; STEMI, ST-segment elevation myocardial infarction; POCE, patient-oriented composite endpoint.
Table 3. Ten-year outcomes
| 10-year outcomes | LAD-related STEMI (N = 631) | Non-LAD-related STEMI (N = 867) | Unadjusted HR (95%CI) | Adjusted HR (95%CI) | Expanded adjusted HR (95%CI) | |||
|---|---|---|---|---|---|---|---|---|
| Patient-oriented composite endpointc | 220 (34.9) | 307 (35.4) | 0.99 (0.83-1.17) | .87 | 0.95 (0.79-1.13) | .56 | 0.98 (0.78-1.23) | .86 |
| All-cause mortalityd | 131 (21.6) | 179 (21.2) | 1.02 (0.82-1.28) | .84 | 0.93 (0.74-1.18) | .56 | 0.81 (0.59-1.09) | .17 |
| Any myocardial infarctione | 33 (5.5) | 53 (6.3) | 0.86 (0.56-1.33) | .50 | 0.93 (0.60-1.45) | .76 | 1.14 (0.67-1.93) | .61 |
| Any revascularization | 108 (17.4) | 161 (18.8) | 0.93 (0.73-1.18) | .55 | 0.96 (0.75-1.22) | .72 | 1.12 (0.83-1.52) | .45 |
| Device-oriented composite endpointf | 94 (14.3) | 132 (14.2) | 0.98 (0.75-1.28) | .88 | 0.91 (0.70-1.20) | .50 | 0.95 (0.67-1.35) | .77 |
| Cardiac death | 72 (9.8) | 95 (10.0) | 1.06 (0.78- 1.44) | .71 | 0.89 (0.65- 1.23) | .49 | 0.71 (0.47-1.09) | .12 |
| Target vessel myocardial infarction | 16 (2.6) | 36 (4.2) | 0.62 (0.34-1.11) | .10 | 0.69 (0.38-1.25) | .22 | 0.87 (0.43-1.77) | .71 |
| Target lesion revascularization | 44 (7.0) | 63 (7.3) | 0.97 (0.66-1.43) | .89 | 1.01 (0.68-1.49) | .96 | 1.20 (0.76-1.93) | .43 |
| Definite/probable stent thrombosisg | 17 (2.7) | 28 (3.3) | 0.84 (0.46-1.54) | .57 | 0.83 (0.45-1.55) | .57 | 0.80 (0.38-1.73) | .58 |
|
95%CI, 95% confidence interval; HR, hazard ratio; LAD, left anterior descending artery, STEMI: ST-elevation myocardial infarction. Data are expressed as no. (%). aCause-specific Cox regression model adjusted for sex, smoking status, peripheral vascular disease, previous percutaneous coronary intervention, previous coronary artery bypass graft, previous myocardial infarction, and Killip class. bCause-specific Cox regression expanded model, adjusted for baseline comorbidities and left ventricular ejection fraction at discharge. cComposite endpoint of all-cause death, any recurrent myocardial infarction, and any revascularization. dDeath was adjudicated according to the Academic Research Consortium definition. eMyocardial infarction was adjudicated according to the World Health Organization extended definition. fComposite endpoint of cardiac death, target vessel myocardial infarction, target lesion revascularization, and stent thrombosis. gStent thrombosis was defined according to the Academic Research Consortium definition. |
||||||||
Landmark analyses
POCE landmark analysis showed no differences between the 2 groups across different time points. (figure 4A). Looking specifically at the various POCE individual components, the LAD-STEMI group exhibited a higher rate of all-cause mortality within the first year vs the non-LAD-STEMI group (p = 0.041), but this difference disappeared thereafter (figure 4B). Between years 0 and 1, there was also a trend toward a lower rate of myocardial infarction in the LAD-STEMI group vs the non-LAD-STEMI group (p = 0.081), which disappeared after year 1 (figure 4C). No differences were ever found regarding any revascularization (figure 4D) or other secondary endpoints between the 2 groups (figure 2 of the supplementary data).

Figure 4. Landmark analysis for the patient-oriented composite endpoint (A), all-cause mortality (B), myocardial infarction (C), and any revascularization (D) in patients stratified according to the culprit vessel. LAD, left anterior descending coronary artery; MI, myocardial infarction; STEMI, ST-segment elevation myocardial infarction; POCE, patient-oriented composite endpoint.
DISCUSSION
The main findings of this study can be summarized as follows: a) STEMI patients with LAD as the culprit vessel have a different baseline clinical profile vs STEMI patients with other culprit vessels; b) in the contemporary era of primary PCI, LAD as the STEMI-related culprit vessel did not bring worse very long-term outcomes compared with other coronary vessels; c) nevertheless, between years 0 and 1 the LAD-STEMI group exhibited a higher all-cause mortality rate, which disappeared thereafter compared with non-LAD-STEMI group.
Cardiology community knows (as reflected by the ESC guidelines on the management of acute coronary syndromes) that STEMI with LAD involvement as culprit vessel is a clinical marker of high risk of further events.1 LAD-related STEMI represents, approximately, 40% up to 50% of all STEMIs,12,16 and its worse prognosis has been related to the large myocardium covered by the LAD flow compared with the myocardium supplied by other coronary vessels. Of note, those studies were performed in the pre-reperfusion4-7 and early thrombolysis/PCI era,8,9 when PCIs were still not widely available. In the PCI era, there are very few studies (with short or mid-term follow-ups ranging from 1 to 3 years) reporting that LAD-STEMI is associated with an increased risk of stroke, heart failure, all-cause mortality10,17 and cardiovascular death11 after the PCI.
In our analysis, conducted in a cohort where the PCI was extensively performed, LAD as the STEMI culprit vessel did not appear to confer a worse prognosis to patients at the 1- or even 10-year follow-up. Of interest, LAD-STEMI patients exhibited the classical clinical features related to LAD, such as advanced Killip class at the time of presentation, lower ST-segment resolution and lower LVEF, which is similar to previous studies.8-11,17 All these unfavorable clinical characteristics are indeed related to the large amount of myocardium damaged in a LAD-STEMI with subsequent heart failure and ventricular arrhythmias.17-19 Nevertheless, this did not translate into a worse, very long-term clinical outcome. Significantly, even after accounting for variations in LVEF (which we addressed separately in our model due to its perceived role in the outcome cascade) the results showed no differences. This observation stands in contrast to earlier evidence, where the higher mortality rate in this cohort had been partially attributed to the subsequent decline in LVEF after STEMI.9,10
Several explanations may be claimed to understand our main finding. It may be hypothesized that worse outcome related to anterior STEMI may have been overcome by the introduction of the PCI with quick myocardial reperfusion. Pharmacological treatment has been also improved from thrombolysis to the PCI era, not only in terms of antiplatelet agents, but also in terms of secondary prevention (high intensity statins and angiotensin converting enzyme inhibitors/angiotensin receptor blockers or angiotensin receptor/neprilysin inhibitors for left ventricular dysfunction).20-23 Furthermore, in our study, the LAD-STEMI group had a higher proportion of active smokers. Smoking cessation remains the most critical preventive measure for coronary artery disease. The relationship between smoking and cardiovascular outcomes has been a matter of discussion, as some studies have suggested improved cardiovascular outcomes, even in the long term, among smokers who experienced STEMI.24 However, many of these studies were observational registries conducted in the pre-PCI era. Recent evidence indicates that smoking is associated with more post-PCI long-term adverse outcomes.25 Therefore, the so-called “smoker’s paradox” might be better explained by factors such as younger age and a lower prevalence of other risk factors among smokers. Indeed, in our study, while the LAD-STEMI group had a higher proportion of smokers, they had a lower prevalence of other risk factors, such as peripheral vascular disease and a history of prior PCI or MI.
Last, but not least, in landmark analysis we found that between years 0 and 1, all-cause mortality was more common in the LAD-STEMI group. Notably, in this period, there was a numerically higher number of cardiac deaths (although not statistically significant, P = .12), a similar finding to other existing evidence that found a higher relatively short-term mortality in the LAD-STEMI group within the first 30 days. In these studies, the elevated short-term mortality was associated with acute sequelae, such as heart failure and was also speculated to be connected to other lethal complications, such as ventricular arrhythmias, cardiogenic shock or mechanical complications.10,11 In our cohort, we found a trend towards a higher rate of reinfarction in the non-LAD-STEMI group (P = .081) that was largely unrelated to TLR, TVMI, or stent thrombosis. This observation contrasts with previous literature that reported a more common occurrence of reinfarction at the follow-up in patients with the SVG as the culprit vessel26 as well as the LAD,8 but not in LCx or the RCA.9-11
Our 10-year follow-up revealed similar clinical event rates between LAD-STEMI and non-LAD-STEMI group, indicating absence of long- term divergence. Previous studies showed a favorable post-acute phase prognosis for LAD-STEMI patients,10,11 which is consistent with our findings. In fact, non-cardiac factors seem to impact long-term mortality more than infarct location does.19 Thus, patients with STEMI should receive uniform management focused on secondary prevention strategies, regardless of the culprit vessel. Unfortunately, insufficient long-term data collection limits deeper insights into these outcomes (such as the presence of heart failure, optimal medical therapy, or other comorbidities).
Limitations
This study presents several limitations. First, this is a non-prespecified post-hoc analysis of the EXAMINATION-EXTEND study and therefore its conclusions must be considered only hypothesis generating. The association between infarction and outcomes may be driven by confounders which have not been recorded in the study. Then, several clinical and procedural characteristics were not available for the analysis, such as specified in-hospital or follow-up clinical data, like optimal medical treatment or compliance to medication at the follow-up.
CONCLUSIONS
In a contemporary cohort of STEMI patients, there were no differences in POCE between LAD as the STEMI-related culprit vessel and other vessels at the 10-year follow-up. However, within the first year after STEMI, all-cause death was more common in the LAD-STEMI group. Our results should be considered as hypothesis-generating. Further studies are needed to specifically assess the relationship between infarction location and outcomes in a contemporary setting where interventional and medical treatments are optimized.
FUNDING
The EXAMINATION-EXTEND study was funded by an unrestricted grant of Abbott Vascular to the Spanish Society of Cardiology (promoter). P. Vidal Calés has been supported by a research grant provided by Hospital Clínic at Barcelona, Spain.
ETHICAL CONSIDERATIONS
The study fully complied with the Declaration of Helsinki and was approved by our Institutional Review Committee. All patients signed a written informed consent form before being included in this study. The clinical ethics committee gave its approval for the analysis of the data collected. In this work, SAGER guidelines regarding sex and gender bias have been followed.
STATEMENT ON THE USE OF ARTIFICIAL INTELLIGENCE
No artificial intelligence tools were used during the preparation of this work.
AUTHORS’ CONTRIBUTIONS
The authors declare they meet the full criteria and requirements for authorship and have reviewed and agree with the content of the article. P. Vidal Calés, K. Bujak, R. Rinaldi, A. Salazar Rodríguez, S. Brugaletta and M. Sabaté contributed to conceptualization, design, data analysis and drafting of the manuscript. L. Ortega-Paz, J. Gómez-Lara, V. Jiménez-Diaz, M. Jiménez, P. Jiménez-Quevedo, R. Diletti, P. Bordes, G. Campo, A. Silvestro, J. Maristany, X. Flores, A. De Miguel-Castro, A. Íñiguez, A. Ielasi, M. Tespili, M. Lenzen, N. Gonzalo, M. Tebaldi, S. Biscaglia, R. Romaguera, J.A. Gómez-Hospital and P. W. Serruys reviewed and edited the manuscript.
CONFLICTS OF INTEREST
M. Sabaté declares he has received consulting fees from Abbott Vascular and iVascular outside the submitted work. R. Romaguera is associate editor of REC: Interventional Cardiology. The journal’s editorial procedure to ensure impartial handling of the manuscript has been followed. The rest of the authors declared no conflicts of interest whatsoever.
WHAT IS KNOWN ABOUT THIS TOPIC?
- – In STEMI patients, the culprit vessel is often regarded as a crucial prognostic factor.
- – This assumption is based on earlier studies conducted during the pre-reperfusion or thrombolysis era, which demonstrated that STEMIs involving the left anterior descending coronary artery (LAD) were linked to poorer clinical outcomes vs those involving other vessels.
- – In the current PCI era, there is limited data on the long-term prognostic impact of the LAD as the culprit vessel in STEMI patients.
WHAT DOES THIS STUDY ADD?
- – Patients with LAD as the STEMI-related culprit vessel have a higher all-cause mortality within the first year after STEMI.
- – However, our study found that this difference did not persist beyond the initial year suggesting that the prognostic impact of the culprit vessel might pertain to the immediate post- STEMI period.
- – Moreover, our results support that (irrespective of the location of the infarction) all STEMI patients should receive uniform medical care in the long-term focused on implementing secondary prevention strategies.
SUPPLEMENTARY DATA
REFERENCES
1. Byrne RA, Rossello X, Coughlan JJ, et al. 2023 ESC Guidelines for the management of acute coronary syndromes. Eur Heart J. 2023;44:3720-3826.
2. De Luca G, Suryapranata H, van 't Hof AW, et al. Prognostic assessment of patients with acute myocardial infarction treated with primary angioplasty:implications for early discharge. Circulation. 2004;109:2737-2743.
3. Addala S, Grines CL, Dixon SR, et al. Predicting mortality in patients with ST-elevation myocardial infarction treated with primary percutaneous coronary intervention (PAMI risk score). Am J Cardiol. 2004;93:629-632.
4. Thanavaro S, Kleiger RE, Province MA, et al. Effect of infarct location on the in-hospital prognosis of patients with first transmural myocardial infarction. Circulation. 1982;66:742-747.
5. Stone PH, Raabe DS, Jaffe AS, et al. Prognostic significance of location and type of myocardial infarction:independent adverse outcome associated with anterior location. J Am Coll Cardiol. 1988;11:453-463.
6. Hands ME, Lloyd BL, Robinson JS, de Klerk N, Thompson PL. Prognostic significance of electrocardiographic site of infarction after correction for enzymatic size of infarction. Circulation. 1986;73:885-891.
7. Welty FK, Mittleman MA, Lewis SM, Healy RW, Shubrooks SJ, Jr., Muller JE. Significance of location (anterior versus inferior) and type (Q-wave versus non-Q-wave) of acute myocardial infarction in patients undergoing percutaneous transluminal coronary angioplasty for postinfarction ischemia. Am J Cardiol. 1995;76:431-435.
8. Kandzari DE, Tcheng JE, Gersh BJ, et al. Relationship between infarct artery location, epicardial flow, and myocardial perfusion after primary percutaneous revascularization in acute myocardial infarction. Am Heart J. 2006;151:1288-1295.
9. Elsman P, van 't Hof AW, de Boer MJ, et al. Impact of infarct location on left ventricular ejection fraction after correction for enzymatic infarct size in acute myocardial infarction treated with primary coronary intervention. Am Heart J. 2006;151:1239.
10. Entezarjou A, Mohammad MA, Andell P, Koul S. Culprit vessel:impact on short-term and long-term prognosis in patients with ST-elevation myocardial infarction. Open Heart. 2018;5:e000852.
11. Koga S, Honda S, Maemura K, et al. Effect of Infarction-Related Artery Location on Clinical Outcome of Patients With Acute Myocardial Infarction in the Contemporary Era of Percutaneous Coronary Intervention- Subanalysis From the Prospective Japan Acute Myocardial Infarction Registry (JAMIR). Circ J. 2022;86:651-659.
12. Sabate M, Cequier A, Iñiguez A, et al. Everolimus-eluting stent versus bare-metal stent in ST-segment elevation myocardial infarction (EXAMINATION):1 year results of a randomised controlled trial. Lancet. 2012;380:1482-1490.
13. SabatéM, Brugaletta S, Cequier A, et al. Clinical outcomes in patients with ST-segment elevation myocardial infarction treated with everolimus-eluting stents versus bare-metal stents (EXAMINATION):5-year results of a randomised trial. Lancet. 2016;387:357-366.
14. Brugaletta S, Gomez-Lara J, Ortega-Paz L, et al. 10-Year Follow-Up of Patients With Everolimus-Eluting Versus Bare-Metal Stents After ST-Segment Elevation Myocardial Infarction. J Am Coll Cardiol. 2021;77:1165-1178.
15. SabatéM, Cequier A, Iñiguez A, et al. Rationale and design of the EXAMINATION trial:a randomised comparison between everolimus-eluting stents and cobalt-chromium bare-metal stents in ST-elevation myocardial infarction. EuroIntervention. 2011;7:977-984.
16. Nabel EG, Braunwald E. A tale of coronary artery disease and myocardial infarction. N Engl J Med. 2012;366:54-63.
17. Reindl M, Holzknecht M, Tiller C, et al. Impact of infarct location and size on clinical outcome after ST-elevation myocardial infarction treated by primary percutaneous coronary intervention. Int J Cardiol. 2020;301:14-20.
18. Chen ZW, Yu ZQ, Yang HB, et al. Rapid predictors for the occurrence of reduced left ventricular ejection fraction between LAD and non-LAD related ST-elevation myocardial infarction. BMC Cardiovasc Disord. 2016;16:3.
19. Pedersen F, Butrymovich V, Kelbæk H, et al. Short- and long-term cause of death in patients treated with primary PCI for STEMI. J Am Coll Cardiol. 2014;64:2101-2108.
20. Wilt TJ, Bloomfield HE, MacDonald R, et al. Effectiveness of statin therapy in adults with coronary heart disease. Arch Intern Med. 2004;164:1427-1436.
21. Freemantle N, Cleland J, Young P, Mason J, Harrison J. beta Blockade after myocardial infarction:systematic review and meta regression analysis. BMJ. 1999;318:1730-1737.
22. Pfeffer MA, Greaves SC, Arnold JM, et al. Early versus delayed angiotensin-converting enzyme inhibition therapy in acute myocardial infarction. The healing and early afterload reducing therapy trial. Circulation. 1997;95:2643-2651.
23. Mehran R, Steg PG, Pfeffer MA, et al. The Effects of Angiotensin Receptor-Neprilysin Inhibition on Major Coronary Events in Patients With Acute Myocardial Infarction:Insights From the PARADISE-MI Trial. Circulation. 2022;146:1749-1757.
24. Barbash GI, White HD, Modan M, et al. Significance of smoking in patients receiving thrombolytic therapy for acute myocardial infarction. Experience gleaned from the International Tissue Plasminogen Activator/Streptokinase Mortality Trial. Circulation. 1993;87:53-58.
25. Yadav M, Mintz GS, Généreux P, et al. The Smoker's Paradox Revisited:A Patient-Level Pooled Analysis of 18 Randomized Controlled Trials. JACC Cardiovasc Interv. 2019;12:1941-1950.
26. Stone SG, Serrao GW, Mehran R, et al. Incidence, predictors, and implications of reinfarction after primary percutaneous coronary intervention in ST-segment-elevation myocardial infarction:the Harmonizing Outcomes with Revascularization and Stents in Acute Myocardial Infarction Trial. Circ Cardiovasc Interv. 2014;7:543-551.

ABSTRACT
Introduction and objectives: Calcified coronary lesions are becoming more prevalent and remain therapeutically challenging. Although a variety of devices can be used in this setting, cutting balloons (CB) and scoring balloons (SB) are powerful and simple tools to treat calcified plaques vs more complex devices. However, there are some drawbacks: these are stiff and bulky balloons that, as a first device, complicate lesion crossing and navigability in the presence of tortuosity, thus making it extremely difficult to recross once the balloon has been inflated. The objective of this study was to evaluate the safety and efficacy profile of the new Naviscore SB designed to overcome these drawbacks.
Methods: The first-in-man Naviscore Registry is a multicenter, prospective trial that included 85 patients with moderate (34%) or severe (66%) de novo calcified coronary lesions located in the native arteries, with stable angina and an indication for percutaneous coronary intervention.
Results: Mean age was 71 ± 11 years, with a high prevalence of comorbidities. Used as the first device, the Naviscore was able to cross 76% of the lesions and was used in 98% of the cases effectively modifying the calcified plaque. Procedural success was achieved in 94% of cases. Basal stenosis of 81 ± 12% decreased to 33 ± 8.5% after Naviscore and to 7.5 ± 2.6% after stent implantation. There were no major adverse cardiovascular events during admission. Perforation, device entrapment or flow-limiting dissections did not occur—only type A/B dissections in 13%—which were fixed with stent implantation. Device performance was deemed superior to the usual SB or CB used by the participant centers.
Conclusions: The Naviscore SB is very effective crossing severely calcified lesions as the first device, with effective plaque modification, stent expansion and an excellent safety profile. The Naviscore improves the behavior of current CB and SB. Due to its simplicity of use and performance, the Naviscore can be the first-choice SB to treat significant calcified lesions.
Keywords: Calcified coronary lesions. Scoring balloon. Plaque modification.
RESUMEN
Introducción y objetivos: Las lesiones coronarias calcificadas son cada vez más prevalentes y suponen un reto terapéutico. Aunque se pueden tratar con distintos dispositivos, los balones de corte (BC) y de scoring (BS) son herramientas potentes y de más fácil uso que otros dispositivos de mayor complejidad. Sin embargo, tienen un alto perfil de cruce, son rígidos y cuesta cruzar la lesión como primer dispositivo; navegan mal y es difícil recruzar cuando ya se ha dilatado el balón. El objetivo del estudio fue evaluar la eficacia y la seguridad del nuevo BS Naviscore, diseñado para soslayar estos inconvenientes.
Métodos: El Registro Naviscore es un estudio por primera vez en humanos, multicéntrico y prospectivo, en 85 pacientes con lesiones coronarias de novo con calcificación moderada (34%) o grave (66%), localizadas en arterias nativas, con angina estable e indicación de angioplastia.
Resultados: La edad media fue de 71 ± 11 años y hubo una alta prevalencia de comorbilidad. Naviscore cruzó como primer dispositivo en el 76% de los casos y se empleó hasta en el 98% para dilatar la lesión. Se logró el éxito del procedimiento en el 94%. La estenosis basal pasó del 81 ± 12 al 33 ± 8,5% después de Naviscore y al 7,5 ± 2,6% después del stent. No se registraron eventos coronarios adversos durante la hospitalización. Tampoco hubo casos de perforación, atrapamiento del dispositivo ni disección limitante del flujo; solo disecciones tipo A/B en el 13%, resueltas tras el stent. El comportamiento de Naviscore se evaluó como superior al de los BC o BS habituales en los centros participantes.
Conclusiones: Naviscore tiene una alta capacidad de cruce de las lesiones como primer dispositivo, una gran eficacia en la modificación de la placa y un excelente perfil de seguridad. Por su facilidad de uso y eficacia, Naviscore podría considerarse como el BS de primera elección en el tratamiento de lesiones calcificadas complejas.
Palabras clave: Lesiones coronarias calcificadas. Balón scoring. Modificación de placa.
Abbreviations:
CB: cutting balloon. PCI: percutaneous coronary intervention. SB: scoring balloon.
INTRODUCTION
Currently, the number of percutaneous coronary interventions (PCI) involving moderate-to-severe calcified plaques is increasing due to a progressively aging population and extending procedural indications into more comorbid patients. The presence of such calcification is extremely relevant as it is strongly associated with worse outcomes, specially by means of stent underexpansion, a potent predictor of stent thrombosis or in-stent restenosis.1-3 Moreover, calcified plaques can make advancing the devices difficult and trigger stent deformation and entrapment, coronary artery dissection, or perforation.1,4-6. Currently, there is a growing interest in the assessment of plaque morphology and its modification prior to stent implantation, which has led to the development of multiple tools such as rotational atherectomy, lithotripsy, orbitational atherectomy, cutting balloons (CB) and scoring balloons (SB).7-11 The latter are easy to use and aim to create a controlled fracture of calcium deposits and plaque dilatation to facilitate stenting.12-14 However, despite their theoretical simplicity, these devices are bulky and stiff, making it difficult to cross the lesion at the first attempt, navigate the vessel, and recross the lesion once inflated. Therefore, there is a need for a more trackable and better-profiled SB to improve the uptake of these devices to treat calcified coronary artery disease.
The newly designed Naviscore SB (iVascular, Spain) seeks to address these drawbacks. Its structure is based on 125-µm thick nitinol laser cut filaments arranged in an axial pattern placed over a semi-compliant high-pressure balloon with a nominal pressure of 8 atm, a rated burst pressure of 20 atm, and a mean burst pressure of 26 atm (figure 1). A nylon compensation tube in the shaft helps to re-wrap during balloon deflation. The mechanical properties of nitinol tend to regain its original shape once the balloon has been deflated. The nylon compensation tube elongates once the balloon has been inflated and due to its elastic properties, it regains its original length when deflated (video 1 of the supplementary data). The 2 mechanisms produce a powerful re-wrapping of the entire system when the balloon has been deflated, regaining its original crossing profile, which allows for easy lesion recross and further dilatations as many times as required. Axial distribution of scoring elements provides a high push against calcified lesions. Nitinol elastic properties provide a better navigability through tortuous calcific vessels compared with rigid scoring elements, such as stainless steel. The durable hydrophilic coating of the Hydrax Plus catheter (iVascular, Spain) significantly reduces its coefficient of friction to 0.04 by increasing slip and navigability. Also, its axial design enables a far larger contact area with the vessel wall compared with other devices with spiral configuration of nitinol filaments such as the AngioSculpt catheter (Philips Healthcare, The Netherlands) (figure 2). In vitro testing (iVascular, Spain) was conducted to measure the crossing profile of different SBs using a non-contact laser meter where the profile is calculated through the shadow that has been created. This allows us to measure the profile without exerting any pressure on the device.15 The Naviscore crossing profile is 5% lower than Angiosculpt, and 31% lower than Wolverine (Boston Scientific, United States). This catheter is available in a wide range of measures from 1.5 mm up to 3.5 mm in diameter and from 6.0 mm up to 15 mm in length, all of them compatible with a 6-Fr guiding catheter.

Figure 1. Structure of the Naviscore SB. MBP, mean burst pressure; RBP, rated burst pressure.

Figure 2. In vitro model assessment of the AngioSculpt scoring surface (upper image) vs the Naviscore (lower image). The Naviscore scoring surface is 6 times larger than that of the AngioSculpt.
The present study aims to demonstrate the safety and efficacy profile associated with crossing and treating calcified coronary lesions with the Naviscore SB.
METHODS
The Naviscore first-in-man study is a multicentric and prospective registry that evaluated the device safety and efficacy profile in the treatment of calcified lesions in 85 patients from 10 centers (9 in Spain and 1 in Portugal), all from the Euro 4C Group, founded in 2018 and focused on the cardiac care of calcified and complex patients. All operators involved in this study were experts in the treatment of calcified coronary lesions and familiar with most tools designed to treat such lesions.
Inclusion criteria were the presence of de novo moderate-to-severe calcified lesions by angiographic criteria in the native coronary tree of patients with chronic coronary syndrome scheduled for a PCI due to symptom persistence despite optimal medical therapy and/or evidence of inducible ischemia. The only exclusion criterion was the presence of the patient’s hemodynamic compromise.
The study was designed to assess the safety and efficacy profile of Naviscore in terms of delivery success when used as the first device to dilate the lesion, plaque modification capabilities, and complications. Consequently, operators were asked to use the Naviscore in all cases as the first device to cross and dilate the lesion. However, in cases of failed lesion crossing, dilatation with a small balloon was recommended with subsequent re-use of the same Naviscore catheter.
Operators involved in the study had little prior experience with the Naviscore in, at least, 3 cases and were asked to include, at least, 5 patients in the study. The operators assessed the performance of the catheter in each procedure in terms of pushability, navigability, crossing, deflation time, re-wrap, recrossing capabilities and ease of retrieval, and made a subjective comparison with their routinely used SB or CB.
The baseline clinical characteristics were recorded prior to the procedure and angiographical and optical coherence tomography (OCT) images were analyzed separately by 2 different operators. Coronary angiography was performed using, at least, 2 orthogonal projections to show stenosis as it is commonly used in the routine clinical practice. The view with the most severe stenosis was selected for the quantitative analysis of the lesion before and after the PCI. Lesion calcification was angiographically categorized as none/mild, moderate (radiopacities were only noted during the cardiac cycle movement prior to contrast injection) or severe (radiopacities noted without cardiac movement prior to contrast injection involving both sides of the arterial lumen).16 Lesions were categorized as A, B1, B2 and C based on the modified ACC/AHA Task Force classification, which is in turn, based on the morphology and potential complexity of the PCI.17 Procedural success was defined as an angiographically residual percent diameter stenosis < 30% after stent implantation, absence of major complications and final Thrombolysis in Myocardial Infarction (TIMI) grade-3 flow.18 OCT analysis was performed as recommended in the routine clinical practice: lesion and proximal and distal references within 5 mm were used to estimate diameters and areas. Calcium cracks were defined as fissures involving a calcified region.19,20
Statistical analysis
Data are expressed as mean ± standard deviation for continuous variables with a normal distribution, median and interquartile range [IQR] for continuous variables with a non-Gaussian distribution, and counts and percentages for categorical data.
Statistical analyses were performed using the Stata software version 16.1 (College Station, TX, United States).
Ethical considerations
Informed consent was obtained from all the patients and the study was approved by the Research Ethics Committee. The authors declare that procedures were followed according to the regulations established by the Clinical Research and Ethics Committee and the Declaration of Helsinki of the World Medical Association.
RESULTS
From November 2021 through February 2022, a total of 85 patients—80% males—with a mean age of 71 ± 11 years were included in the present study. One center included a total of 21 patients and the remaining 9, between 5 and 10 patients each. Baseline patient and lesion characteristics are shown in table 1. Regarding comorbidities, the prevalence of diabetes mellitus, dyslipidemia, hypertension, and chronic kidney disease was 44%, 70%, 75%, and 18% respectively. Prior revascularization was present in 43% of the patients (PCI in 38% and coronary artery bypass graft in 16%). The left anterior descending coronary artery was the most common location of target lesions (41%), followed by the right coronary artery (28%), left circumflex artery (16%) and left main coronary artery (15%). Most lesions (87%) were categorized as type B2/C, 66% were severely calcified and 34% had moderate calcification by angiographic assessment. Chronic total occlusion was reported in 10% of treated lesions. Reference vessel diameter was 3.0 ± 0.5 mm; mean lesion length, 20.3 ± 9.4 mm; and diameter stenosis, 81.4 ± 12%.
Table 1. Baseline clinical and angiographic characteristics
| Clinical and angiographic characteristics (n = 85) | n (%) |
|---|---|
| Age, years | 71 ± 11 |
| Male | 68 (80%) |
| Diabetes | 37 (44%) |
| Dyslipidemia | 59 (70%) |
| Hypertension | 67 (75%) |
| Chronic kidney disease | 15 (18%) |
| Current/former smokers | 53 (62%) |
| Prior PCI/CABG | 37 (43%) |
| Type B2/C lesions | 74 (87%) |
| Severe calcification | 56 (66%) |
| Moderate calcification | 29 (34%) |
| Basal percent diameter stenosis | 81 ± 12% |
| Chronic total occlusion | 8 (10%) |
| Lesion location: Left main coronary artery | 13 (15%) |
| LAD | 35 (41%) |
| RCA | 24 (28%) |
| LCx | 13 (16%) |
|
CABG, coronary artery bypass graft; LAD, left anterior descending coronary artery; LCx, left circumflex artery; PCI, percutaneous coronary intervention; RCA, right coronary artery. |
|
The Naviscore catheter diameters used to dilate the lesions were 2.0 mm (21%), 2.5 mm (38%), 3.0 mm (31%), and 3.5 mm (10%). Mean number of device inflations was 2.7 ± 1.5 times.
The Naviscore crossing performance of is shown in figure 3. Despite the strong recommendation to use Naviscore as the first device, some operators decided to use Rotablator or small balloons first in 10 patients due to severely narrowed and/or calcified vessels. In all those cases, the Naviscore successfully crossed and dilated the lesion after the first attempt. In the 75 patients in whom the Naviscore was used as the first device, the lesions were crossed and treated successfully in 57 (76%) of them. In the remaining 18 (24%) patients, the Naviscore crossed the lesion after pre-dilatation with a small balloon in 16 (89%) patients. Only 2 patients had non-crossable lesions.

Figure 3. Crossing performance of the Naviscore.
PCI results and in-hospital outcomes are shown in table 2. Procedural success was achieved in 94% of cases. The mean lesion percent diameter stenosis decreased from 81.4 ± 12% at baseline to 33.3 ± 8.5% after Naviscore dilatation, with a residual percent diameter stenosis of 7.5 ± 2.6% after stent implantation. There were no in-hospital major adverse cardiovascular events or any cases of perioperative perforation or device entrapment. Coronary dissections occurred in 13% of the cases (all of them type A or B) and resolved after stent implantation.
Table 2. Angiographic and in-hospital results
| Angiographic and in-hospital clinical results (n = 85) | n (%) |
|---|---|
| Procedural success: residual percent diameter stenosis < 30% after stenting, absence of major complications and TIMI grade-3 flow | 80 (94%) |
| Percent diameter stenosis pre-Naviscore | 81 ± 12% |
| Percent diameter stenosis post-Naviscore | 33 ± 8.5% |
| Percent diameter stenosis post-stenting | 7.5 ± 2.6% |
| MACE (in-hospital) | 0% |
| Death, MI, emergency CABG | 0% |
| Perforation | 0% |
| Limiting flow dissection | 0% |
| Type A or B dissection | 11 (13%) |
| Device entrapment | 0% |
|
CABG, coronary artery bypass graft; MACE, major adverse cardiovascular events; MI, myocardial infarction; TIMI, Thrombolysis in Myocardial Infarction. |
|
Ten procedures were OCT-guided. Pre-dilatation analysis could only be performed in 5 lesions; the OCT catheter could not cross the remaining lesions. Four of those had Fujino’s scores8 of 4 and in 2 of them the nodules protruded into the lumen. After dilatation, all lesions exhibited dissections that covered the intima and the media. Fractures were seen in all calcified plaques, which were deeper and wider in non-nodular calcified regions. Enlargement of lumen area after treatment with the Naviscore and correct stent apposition and expansion was observed in all imaging-guided cases (figure 4).

Figure 4. Clinical examples of 2 different lesions treated with the Naviscore. Angiography and baseline OCT (A) after dilatation with the Naviscore catheter (B) and post-stent implantation (C). On the left side, panel A shows a severely stenotic fibrocalcific plaque on the left anterior descending coronary artery that Naviscore (B) modifies creating calcium fractures (*) and dissection (arrow) resulting in stent implantation with good apposition and expansion (C). The right side shows a severely calcified plaque on the right coronary artery (A) with an arc of calcium of 180º at its proximal edge (lateral OCT picture) and 360º at its distal edge (central OCT picture) that the Naviscore modifies (B) creating calcium fractures (*) and dissection (arrow) resulting in stent implantation with good apposition and expansion (C). OCT, optical coherence tomography.
Table 3 shows the subjective performance of the Naviscore as evaluated by the operators of the present study. The Naviscore performance including push, navigability, crossing, deflation time, re-wrap, recrossing capabilities and ease of retrieval was deemed superior to the Wolverine, NSE Alpha (Nipro Co. Ltd., Japan), AngioSculpt, and Scoreflex (OrbusNeich, China).
Table 3. Subjective performance of the Naviscore compared with traditional and scoring or cutting balloons of participant centers. Push, capacity to cross the lesion, deflation time, rewrap and recrossing capabilities were the most valued characteristics of the Naviscore
| Parameter | Push | Navigability | Crossing | Friction | Device visibility | Deflation time | Rewrap | Recrossing capability | Ease of retrieving | Global evaluation |
|---|---|---|---|---|---|---|---|---|---|---|
| Better | 60% | 54% | 63% | 52% | 34% | 65% | 65% | 69% | 53% | 78% |
| Equal | 38% | 46% | 35% | 46% | 65% | 34% | 34% | 29% | 46% | 21% |
| Worse | 2% | 0% | 2% | 2% | 1% | 1% | 1% | 2% | 1% | 1% |
DISCUSSION
Findings of this first-in-man registry with the new SB Naviscore in moderately to severely calcified coronary lesions performed in CHIP (complex and high-risk intervention in indicated patients) by highly experienced operators on this field can be summarized as follows: a) the Naviscore was able to cross the lesions as the first device in 3 out of 4 patients in such difficult scenario; b) this device proved to be effective to treat complex coronary lesions, with procedural success rates of 94%; c) the Naviscore was safe as no major dissection, perforation, or device entrapment were observed and d) the performance of the Naviscore SB was better compared with other commercially available SB and CB as subjectively assessed by the experienced operators in this study.
Calcified coronary lesions account for up to 30% of lesions scheduled for PCI and are associated with worse clinical outcomes.1 Furthermore, these lesions are probably the most challenging ones for PCI operators. Thus, it is of paramount importance to develop specific devices for this scenario.21-23 Although several plaque-modification techniques have appeared in recent years, there are not very many head-to-head comparisons, thus complicating the choice between them. In contrast, several treatment combinations and algorithms have been published.24-27 Ablation techniques, such as rotational or orbital atherectomy, are especially indicated in uncrossable or undilatable lesions with balloon catheters. However, since there are more potential complications and a steeper learning curve associated with these therapies, developing new tools with a better crossing profile would be very positive in this scenario. The good crossability of the Naviscore SB showed in the present study is probably related to its unique nitinol structure in an axial configuration. CB such as the Wolverine or the NSE Alpha have a similar axial configuration of their cutting elements. However, the crossing profile of the Naviscore is 31% smaller than the CB. Although a comparative study on the crossing capabilities of those devices is not available, such a different profile favors the superior crossing capabilities of the Naviscore device. In fact, the operators of the present registry highlighted the ability to cross and recross lesions as one of the best features of the device compared with their usual CB or SB. Compared with the AngioSculpt—a SB that shares a nitinol structure with the Naviscore— the helical configuration of nitinol filaments in front of the axial alignment of the Naviscore nitinol filaments can make a difference. Axial alignment adds push to the device through the lesion, while the helical nitinol configuration can deform the structure under friction, thus reducing its navigability and, in some cases, cause device entrapment.28 Furthermore, as shown in figure 2, helical distribution of nitinol significantly reduces the nitinol scoring surface in front of an axial distribution.
The efficacy of the Naviscore balloon has proven to be good in the present study, with a procedural success rate of 94%. Furthermore, quantitative angiographic analysis showed a reduction of basal stenosis from 81% to 31% after Naviscore dilatation and to 7.5 ± 2.6% after stent implantation. Finally, the OCT evaluation confirmed the presence of extensive calcium fractures caused by the scoring filaments (figure 4). As the balloon gradually inflates, the radial forces concentrate along the surface of the nitinol scoring elements, resulting in a more controlled balloon expansion, increasing the force of the nitinol frame filaments to break down the calcified plaques.29 In vitro experiments comparing a simple SB (Scoreflex) with a conventional balloon catheter to dilate concentric tubes of calcium revealed that the inflation pressure required to break down the calcium tubes was consistently lower with SB. Finite element analysis revealed that the first main stress applied to the calcified plaque was, at least, 3-fold higher when inflating the balloon catheter with scoring elements.30 Naviscore has the largest scoring surface in the SB current market, being 6 times more extensive than the AngioSculpt (figure 2). Pressure concentration of the scoring elements is the mechanism of the increased ability of SB to dilate calcified lesions and facilitate stent expansion. Residual stenosis after stent placement was 7.5 ± 2.6% in our study.
Finally, the Naviscore proved to be safe in the present study, which could be justified by the mechanism of action of the device that uses nitinol filaments as the anchor to avoid balloon slippage, and allows balloon controlled expansion, minimizing the risk of barotrauma, coronary dissection, and perforation. Using OCT imaging, SB broke down the calcified lesion without the undesirable dissection of noncalcified segments, thus allowing successful stent implantation with adequate expansion.29,30
Limitations
One limitation of the study is its own design as a registry and therefore, the absence of a randomized comparator. Instead, expert operators in the treatment of calcified coronary lesions were asked to subjectively compare the device at test with their commonly used SB or CB in terms of push, cross/recross, rewrap, navigability and time of deflation. The subjective nature of this assessment, while providing valuable information, could be a limitation.
Another limitation is the sample size of the study, especially the size of the population involved in the OCT imaging analysis. Unfortunately, in our setting, the use of this technique to analyze calcified lesions, although on the rise, is still far from what would be recommended. However, and despite the limitations in terms of number, the cases analyzed with intracoronary imaging homogeneously show us the effect of the device under study—calcium fractures, dissection and increase in luminal area—as well as the optimal stent expansion.
The small sample of patients in this study does not allow for a disaggregated analysis by sex to draw any valid results.
CONCLUSIONS
The Naviscore SB is a step ahead in this field with an innovative design using a nitinol frame with axial distribution of filaments placed over a high-pressure balloon to improve current SB or CB designs. This provides a strong pushing capability and flexibility to cross the most difficult calcified lesions in 3 out of 4 patients and easily navigate through tortuous anatomy. Superior scoring surface provides strong plaque modification capabilities by facilitating calcium fractures and controlled dissections, and ultimately, optimal stent expansion. Uniform and controlled balloon expansion and the anchor effect provided by the nitinol frame minimizes the risk of uncontrolled dissections and distal embolization, thus providing an outstanding safety profile, confirmed in this study by the absence of major adverse cardiovascular events, device entrapment or flow- limiting dissections. Therefore, the Naviscore can be considered as the front-line SB, either alone or in combination with atheroablative techniques in the treatment of moderate-to-severe calcified lesions.
FUNDING
This study was partly funded by iVascular, Barcelona, Spain, who provided the devices to perform the study.
ETHICAL CONSIDERATIONS
Informed consent was obtained from all patients and the study was approved by the Research Ethics Committee. The authors declare that the procedures were followed in full compliance with the regulations set forth by the Clinical Research and Ethics Committee and Declaration of Helsinki of the World Medical Association. In accordance with the regulations of the SAGER guidelines, the small sample of patients in this study does not allow for a disaggregated analysis by sex to draw any valid results.
STATEMENT ON THE USE OF ARTIFICIAL INTELLIGENCE
No artificial intelligence has been used in the development of this paper.
AUTHORS’ CONTRIBUTIONS
A. Serra Peñaranda designed the protocol, database and study outline, participated in data collection, coordinated data analysis and interpretation, and drafted the article. E. Fernández Peregrina participated in data collection, data analysis and interpretation and drafted the article. M. Jiménez Kockar participated in data collection, data analysis and interpretation, and performed the statistical analysis. B. García del Blanco, S. Romani, J. Martín-Moreiras, E. Pinar Bermúdez, A. Rodrigues, S. Ojeda, N. Gonzalo López, A. Regueiro and A. Serrador Frutos participated in data collection and critically revised the manuscript. All authors gave their final approval to the last version for publication.
CONFLICTS OF INTEREST
S. Ojeda is an associate editor of REC: Interventional Cardiology. The journal’s editorial procedure to ensure impartial handling of the manuscript has been followed. A. Serra Peñaranda and Ander Regueiro received consulting fees from iVascular, Barcelona, Spain. The remaining authors declared no conflicts of interest whatsoever.
WHAT IS KNOWN ABOUT THE TOPIC?
- Calcified coronary lesions are becoming more prevalent in the routine clinical practice and remain therapeutically challenging for interventional cardiologists.
- Careful plaque modification is mandatory prior to stent implantation to achieve optimal results after the PCI.
- Several techniques and devices have been developed in this regard such as rotational and orbital atherectomy, lithotripsy and modified balloons.
- CB and SB are simple devices that do not require a learning curve. However, their design is that of a bulky and stiff device, which complicates lesion crossing, regarding navigation through vessels with some tortuosity and lesion recrossing once dilated.
WHAT DOES THIS STUDY ADD?
- The new Naviscore SB design is highly effective in crossing severely narrowed and calcified coronary lesions at the first attempt and has powerful plaque modification capabilities, while keeping an excellent safety profile.
- This device is a significant improvement over other CB and SB devices currently available in the market and could be selected as the first-choice SB tool to treat moderate-to-severe calcified lesions.
SUPPLEMENTARY DATA
Vídeo 1. Serra Peñaranda A. DOI: 10.24875/RECICE.M24000484
REFERENCES
1. Généreux P, Madhavan MV, Mintz GS, et al. Ischemic outcomes after coronary intervention of calcified vessels in acute coronary syndromes:Pooled analysis from the HORIZONS-AMI (Harmonizing Outcomes with Revascularization and Stents in Acute Myocardial Infarction) and ACUITY (Acute Catheterization and Urgent Intervention Triage Strategy) trials. J Am Coll Cardiol. 2014;63:1845-1854.
2. Fujii K, Carlier SG, Mintz GS, et al. Stent underexpansion and residual reference segment stenosis are related to stent thrombosis after sirolimus-eluting stent implantation:An intravascular ultrasound study. J Am Coll Cardiol. 2005;45:995-998.
3. Kobayashi Y, Okura H, Kume T, et al. Impact of target lesion coronary calcification on stent expansion –An optical coherence tomography study –. Circulation. 2014;78:2209-2214.
4. Hendry C, Fraser D, Eichhofer J, et al. Coronary perforation in the drug-eluting stent era:Incidence, risk factors, management and outcome:The UK experience. EuroIntervention. 2012;8:79-86.
5. Madhavan M, Tarigopula M, Mintz GS, Maehara A, Stone GW, Généreux P. Coronary artery calcification:Pathogenesis and prognostic implications. J Am Coll Cardiol.2014;63:1703-1714.
6. Moussa I, Ellis SG, Jones M, et al. Impact of coronary culprit lesion calcium in patients undergoing paclitaxel-eluting stent implantation (a TAXUS-IV Sub Study). Am J Cardiol. 2005;96:1242-1247.
7. McInerney A, Escaned J, Gonzalo N. Calcified coronary artery disease:pathophysiology, intracoronary imaging assessment, and plaque modification techniques. REC Interv Cardiol. 2022;4:216-227.
8. Fujino A, Mintz GS, Matsumura M, et al. A new optical coherence tomography-based calcium scoring system to predict stent underexpansion. EuroIntervention. 2018;13:e2182-2189.
9. Vaquerizo B, Serra A, Miranda F, et al. Aggressive plaque modification with rotational atherectomy and/or cutting balloon before drug-eluting stent implantation for the treatment of calcified coronary lesions. J Interv Cardiol. 2010;23:240-248.
10. Moussa I, Di Mario C, Moses J, et al. Coronary stenting after rotational atherectomy in calcified and complex lesions. Angiographic and clinical follow-up results. Circulation. 1997;96:128-136.
11. de Maria GL, Scarsini R, Banning AP. Management of Calcific Coronary Artery Lesions:Is it Time to Change Our Interventional Therapeutic Approach?JACC:Cardiovascular Interventions. 2019;12:1465-1478.
12. Sugawara Y, Ueda T, Soeda T, Watanabe M, Okura H, Saito Y. Plaque modification of severely calcified coronary lesions by scoring balloon angioplasty using Lacrosse non-slip element:insights from an optical coherence tomography evaluation. Cardiovasc Interv Ther. 2019;34:242-248.
13. Barath P, Fishbein MC, Vari S, Forrester JS. Cutting balloon:A novel approach to percutaneous angioplasty. Am J Cardiol. 1991;68:1249-1252.
14. Okura H, Hayase M, Shimodozono S, et al. Mechanisms of acute lumen gain following cutting balloon angioplasty in calcified and noncalcified lesions: An intravascular ultrasound study. Catheter Cardiovasc Interv. 2002;57:429-436.
15. Keyence Telecentric measurement System TM-X5000 series. Available at: https://www.keyence.com/products/measure/micrometer/tm-x5000/. Accessed 12 Sep 2024.
16. Mintz GS, Popma JJ, Pichard AD, et al. Patterns of Calcification in Coronary Artery Disease A Statistical Analysis of Intravascular Ultrasound and Coronary Angiography in 1155 Lesions. Circulation. 1995;91:1959-1965.
17. Ellis SG, Vandormael MG, Cowley MJ, et al. Coronary Morphologic and Clinical Determinants of Procedural Outcome With Angioplasty for Multivessel Coronary Disease Implications for Patient Selection. Circulation. 1990;82:1193-1202.
18. TIMI Study Group. The thrombolysis in myocardial infarction (TIMI) trial. N Engl J Med. 1985;312:932-936.
19. Räber L, Mintz GS, Koskinas KC, et al. Clinical use of intracoronary imaging. Part 1 :guidance and optimization of coronary interventions. An expert consensus document of the European Association of Percutaneous Cardiovascular Interventions. Eurointervention. 2018;14:656-677.
20. Fujino A, Mintz G, Lee T, et al. Predictors of calcium fracture derived from balloon angioplasty and its effect on stent expansion assessed by optical coherence tomography. JACC Cardiovasc Interv. 2018;11:1015-1017.
21. Généreux P, Lee AC, Kim CY, et al. Orbital Atherectomy for Treating De Novo Severely Calcified Coronary Narrowing (1-Year Results from the Pivotal ORBIT II Trial). Am J Cardiol. 2015;115:1685-1690.
22. Kereiakes DJ, Di Mario C, Riley RF, et al. Intravascular Lithotripsy for Treatment of Calcified Coronary Lesions:Patient-Level Pooled Analysis of the Disrupt CAD Studies. JACC Cardiovasc Interv. 2021;14:1337-1348.
23. Abdel-Wahab M, Toelg R, Byrne R, et al. High- speed rotational atherectomy versus modified balloons prior to drug-eluting stent implatation in severely calcified coronary lesions. The randomized PREPARE CALC Trial. Circ Cardiovasc Interv. 2018;11:e007415.
24. Jurado-Román A, Gómez-Menchero A, Gonzalo N, et al. Plaque modification techniques to treat calcified coronary lesions. Position paper from the ACI-SEC. REC Interv Cardiol. 2023;5:46-61.
25. Kawashima H, Kyono H, Nakashima M, et al. Cardiovascular Revascularization Medicine Prognostic impact of scoring balloon angioplasty after rotational atherectomy in heavily calcified lesions using second-generation drug- eluting stents:A multicenter registry-based study. CRM. 2020;21:322-329.
26. Tang Z, Bai J, Su SP, et al. Aggressive plaque modification with rotational atherectomy and cutting balloon for optimal stent expansion in calcified lesions. J Geriatr Cardiol. 2016;13:984-991.
27. Amemiya K, Hwa M, Maehara A, et al. Effect of cutting balloon after rotational atherectomy in severely calcified coronary artery lesions as assessed by optical coherence tomography. Catheter Cardiovasc Interv. 2019;94:936-944.
28. Sanchez Recalde A, Galeote G, Martin-Reyes R, Moreno R. Angiosculpt PTCA Balloon entrapment during dilatation of a heavily calcified lesion. Rev Esp Cardiol. 2008;61:1361-1363.
29. Kanai T, Hiro T, Takayama T, et al. Three-dimensional visualization of scoring mechanism of Angiosculpt balloon for calcified coronary lesions using Optical coherence tomography. J Cardiol Cases. 2021;5:e16-e19.
30. Kawase Y, Saito N, Watanabe S, et al. Utility of a scoring balloon for a severely calcified lesion:bench test and finite element analysis. Cardiovasc Interv Therapeutics. 2014;29:134-139.
- The ultrathin-strut everolimus-eluting stent in a real-world population: the Everythin multicenter registry
- Treatment of functionally nonsignificant vulnerable plaques in multivessel STEMI: design of the VULNERABLE trial
- Incidence and predictors of radial artery occlusion following transradial coronary procedures
- Distal radial access for coronary procedures in an all-comer population: the first 1000 patients in a prospective cohort


Review Articles

Interviews

An interview with Bruno Scheller
aServicio de Cardiología, Hospital Universitario de La Princesa, Instituto de Investigación Sanitaria de La Princesa (IIS-IP), Universidad Autónoma de Madrid, Spain
bCentro de Investigación Biomédica en Red de Enfermedades Cardiovasculares (CIBERCV), Instituto de Salud Carlos III, Madrid, Spain


