Original articles

Select your language

e-ISSN: 2604-7322
Available online: 26/04/2019
Valvulopathy
REC Interv Cardiol. 2019;1:34-40
Cambios morfológicos anulares tras reparación mitral transcatéter: repercusión clínica y relevancia de la etiología
Área del Corazón, Hospital Universitario Central de Asturias, Oviedo, Asturias, España

Introduction and objectives: Transcatheter aortic valve implantation (TAVI) has emerged as an alternative and less invasive treatment to surgical aortic valve replacement (SAVR). Left ventricular global longitudinal strain (LV-GLS) can reveal changes in left ventricular performance before involvement of ejection fraction. Our aim was to present and evaluate our center’s experience regarding short- and long-term reverse left ventricular remodeling using two-dimensional-speckle tracking echocardiography-derived LV-GLS after TAVI compared with SAVR.
Methods: Our multidisciplinary cardiac team carefully evaluated 65 patients for SAVR who presented with severe symptomatic aortic stenosis and who had high, intermediate, or low surgical risk. The patients underwent either TAVI with an Evolut-R self-expanding valve or SAVR. Echocardiographic evaluation was performed before, 1 month, and 1 year after the procedure.
Results: TAVI was performed in 31 patients and SAVR in 34 patients. The incidence of valvular and paravalvular leak was higher in the TAVI group despite early favorable LV remodeling with a significant decrease in left ventricular mass index and E/e’ shortly after the procedure and an early detectable improvement in LV-GLS from −8.18 ± 1.81 to −14.52 ± 2.52, reaching −16.12 ± 2.69 at 1 year (P < .001). This early improvement was not observed in the SAVR group. TAVI preserved right ventricular function without affecting tricuspid annular plane systolic excursion or increasing estimated pulmonary artery pressure.
Conclusions: Patients who underwent TAVI had earlier and significantly better LV remodeling with early reduction in left ventricular mass index, E/e’ ratio, and significant early improvement in LV-GLS without concomitant impairment of left ventricular ejection fraction percentage or deterioration of right ventricular function.
Keywords: Left ventricular remodeling. Transcatheter aortic valve implantation. Surgical aortic valve replacement. Two-dimensional speckle tracking. TAVI. SAVR.
Introducción y objetivos: El implante percutáneo de válvula aórtica (TAVI) se ha establecido como una alternativa menos invasiva al recambio valvular aórtico (RVAo). El strain longitudinal global del ventrículo izquierdo (SLG-VI) puede detectar cambios en el funcionamiento ventricular izquierdo antes de que se deteriore la fracción de eyección. Nuestro objetivo fue presentar y evaluar la experiencia de nuestro centro en cuanto al remodelado inverso ventricular izquierdo a corto y largo plazo, utilizando el SLG-VI mediante rastreo de marcas, o speckle tracking, bidimensional, después de TAVI en comparación con los resultados tras RVAo.
Métodos: El equipo cardiológico multidisciplinario evaluó 65 pacientes remitidos para RVAo por estenosis aórtica grave, con riesgo quirúrgico alto, intermedio o bajo. Los pacientes se clasificaron según fueran tratados con TAVI (prótesis autoexpandible Evolut-R) o RVAo. Se realizó ecocardiograma antes del procedimiento, al mes y al año de llevarlo a cabo.
Resultados: 31 pacientes se trataron con TAVI y 34 con RVAo. En el grupo de TAVI hubo mayores tasas de regurgitación valvular y paravalvular. Se observó un remodelado ventricular izquierdo más favorable, con una disminución significativa del índice de masa del ventrículo izquierdo, un índice E/e’ tras el procedimiento y una mejoría precoz del SLG-VI de −8,18 ± 1,81 a −14,52 ± 2,52, que al año fue −16,12 ± 2,69 (p < 0,0001), sin que esta mejoría precoz en dicho parámetro se evidenciara en el grupo de RVAo. En el grupo de TAVI se mantuvo la función ventricular derecha sin afectar al desplazamiento sistólico del plano tricúspide y sin aumentar la presión sistólica de la arteria pulmonar estimada.
Conclusiones: Los pacientes que recibieron un TAVI tuvieron un mayor y más precoz remodelado ventricular izquierdo, con una reducción precoz del índice de masa del ventrículo izquierdo y del índice E/e’, y una mejoría significativa precoz del SLG-VI, sin alteración de la fracción de eyección del ventrículo izquierdo ni deterioro de la función ventricular derecha.
Palabras clave: Remodelado ventricular izquierdo. Implante percutáneo de válvula aórtica. Recambio valvular aórtico. Speckle tracking bidimensional. TAVI. RVAo.
Abbreviations
AS: aortic stenosis. LV: left ventricular. LVEF: left ventricular ejection fraction. LV-GLS: left ventricular global longitudinal strain. SAVR: surgical aortic valve replacement. TAVI: transcatheter aortic valve implantation.
Degenerative calcific aortic stenosis (AS) is the most common valvular heart disease worldwide. For severe symptomatic cases, surgical aortic valve replacement (SAVR) has been the gold standard procedure for decades.1
However, since its introduction in 2002, transcatheter aortic valve implantation (TAVI) has emerged as a less invasive alternative treatment with a shorter recovery time and lower perioperative mortality rate. Initially, the procedure was introduced for patients with high2,3 and intermediate surgical risk.4,5 However, advances in technique and operator skills have expanded its use to patients with low surgical risk.6,7
It is well-known that the main problem in people with isolated AS is an increase in afterload, resulting in diastolic dysfunction followed by systolic dysfunction of the left ventricle (LV).8 The optimal timing of intervention, whether surgical or transcatheter, depends on the severity or grades of stenosis, symptoms, and LV dysfunction.9 Aortic valve replacement, whether through TAVI or SAVR, significantly affects LV remodeling, reduces symptoms, and increases overall survival.7
The current guidelines use left ventricular ejection fraction (LVEF) percentage to assess LV systolic function. However, subclinical myocardial dysfunction may develop despite a normal LVEF percentage. Fibrotic changes induced by AS mainly affect LV longitudinal function, while ejection fraction is determined by radial myocardial function. Most cases of severe AS requiring intervention have preserved ejection fraction percentages before and after intervention, with reduced ejection fraction percentages only observed in late and neglected cases with poor prognoses when both radial and longitudinal functions are affected.8 Therefore, assessment of LV function or remodeling before or after the intervention should not be based solely on LVEF. Another reliable method is needed to fully assess the impact of aortic valve replacement on LV function.10
Global longitudinal strain (GLS) analysis has proven useful in accurately characterizing regional and global myocardial systolic function. This analysis can detect changes in LV performance and overcome the limitations of ejection fraction, such as considerable interobserver variability, lack of subtle regional differences, and inadequate acoustic windows, with superior prognostic validity compared with LVEF percentage.10
At Tanta University Hospital, we recently introduced the TAVI procedure. The aim of this study was to present and evaluate the experience of our team and study the impact of aortic valve replacement on several factors. These included prosthesis hemodynamics, significant valvular or paravalvular leak, and the need for new pacemaker implantation. We also aimed to assess short-and long-term reverse LV remodeling by evaluating conventional echocardiographic parameters. In addition, we used the more reliable and accurate two-dimensional (2D) speckle tracking-derived left ventricle global longitudinal strain (LV-GLS) following the TAVI procedure and compared these parameters with the gold standard SAVR.
This longitudinal, prospective, nonrandomized, single-center study was conducted in the Cardiology Department of the Faculty of Medicine at Tanta University Hospital between May 2022 and October 2023. Sixty-five patients diagnosed with severe symptomatic AS, categorized as high, intermediate, or low surgical risk and scheduled for aortic valve replacement, underwent thorough evaluation by the multidisciplinary heart team. Following selection of the appropriate procedure, eligible patients were allocated to undergo either trans-femoral TAVI with an Evolut-R self-expandable valve (Medtronic, United States) or SAVR.
Patients were classified into 2 groups as follows:
– Group I: patients with clinical symptoms, such as chest pain, syncope, or dyspnea, as well as echocardiographic evidence of severe AS (defined as a valvular area ≤ 1 cm2 or indexed valve area ≤ 0.6 cm2/m2, mean pressure gradient ≥ 40 mmHg, and transaortic peak velocity ≥ 4 m/s).9 Patients meeting these criteria were considered suitable candidates for TAVI.
– Group II: patients diagnosed with symptomatic severe AS based on clinical and echocardiographic findings, who were were deemed suitable candidates for SAVR.
We excluded patients if they had any of the following conditions: concomitant significant valvular heart disease other than AS, severe renal impairment (glomerular filtration rate < 30 mL/min/ 1.73 m2), prior biological or bare-metal valve replacement, significant carotid or coronary artery disease, abdominal aortic aneurysm, unstable heart failure, atrial fibrillation, atrial flutter, or any significant rhythm disturbance, predominant aortic regurgitation, infective endocarditis, or severe LV dysfunction (ejection fraction < 35%). We also excluded patients who died during the study period or who lacked echocardiographic data before or after valve replacement.
All patients underwent a full history and clinical evaluation. Data on the length of hospital stay, complications in the perioperative period, and clinical follow-up were collected by a review of medical records.
After the selection of suitable patients and valves, the procedure consisted of 5 sequential steps: access, valve crossing, balloon aortic valvuloplasty, valve implantation, and access closure. Additional considerations included the choice of anesthesia (local with sedation vs general anesthesia) and the placement of a temporary pacing wire in the right ventricle. Most patients underwent the procedure under conscious sedation. The devices used were the Evolut-R self-expandable valves (26, 29, or 34 mm).11
Echocardiographic measurements were performed in accordance with the guidelines of the American Society of Echocardiography and the European Association of Cardiovascular Imaging.12 Using the Vivid E9 ultrasound system (GE Vingmed Ultrasound, Norway), equipped with an M5S phased array transducer (2.5–5.0 MHz) and a dedicated software package, images and data were digitally stored for offline analysis before the procedure, shortly after (1 month), and 9 to 12 months after replacement. All echocardiographic parameters were acquired by 2 trained observers. Three to 5 consecutive beats were recorded and averaged.
LV dimensions, wall thickness, ejection fraction percentage and LV mass index were obtained. The transaortic peak and mean pressure gradients were calculated from the aortic velocity obtained through multiwindow continuous-wave Doppler evaluation using the modified Bernoulli equation.
The effective orifice area of the aortic valve was determined using the continuity equation and was indexed to body surface area as the stroke volume measured in the left ventricular outflow tract (LVOT) divided by the aortic time velocity integral measured by continuous-wave Doppler. LVOT stroke volume was calculated as the LVOT cross-sectional area multiplied by the LVOT time velocity integral, measured by pulsed-wave Doppler.
After aortic valve replacement, the LVOT velocity and diameter were obtained just apical to the prosthetic valve stent or sewing ring. The presence and quantification of any valvular or paravalvular leak were assessed using color and continuous-wave Doppler.
Additional echocardiographic parameters were obtained to assess LV diastolic function, particularly transmitral flow. This included measuring peak early (E) and atrial (A) flow velocities, as well as calculating the E/A ratio. The mean peak early diastolic (e’) velocity was acquired from the septal side of the mitral annulus in the apical 4-chamber view using tissue Doppler settings. The E/e’ ratio was then calculated, serving as an indicator of LV filling pressures.
Conventional parameters were used to assess right-sided function. This included measuring the tricuspid annular plane systolic excursion and evaluating the peak tricuspid regurgitation velocity with color Doppler flow imaging. The estimated systolic pulmonary artery pressure was calculated using the formula: estimated systolic pulmonary artery pressure = right atrial pressure + 4 V2, where V represents tricuspid regurgitant velocity).
Global longitudinal peak systolic strain was assessed offline. Endocardial borders were manually traced and were visualized as a color-coded sequence in individual clips. Subsequently, they were combined in a bull’s-eye plot. The software then calculated the regional and the average strain of the apical 2-chamber, 4-chamber, and 3-chamber views of the 17 segments at an end-systolic frame. Images with a frame rate < 50 were excluded.13 The average peak GLS was then recorded and documented for each study.
The statistical analysis was performed using the Statistical Package for Social Sciences (IBM SPSS Statistics) for Windows, version 26 (IBM Corp., United States). Qualitative variables (eg, sex) are presented as frequencies, and the association of groups with categorical variables was assessed using the Pearson chi-square test for independence, the Fisher-Freeman-Halton exact test, or the Fisher exact test, as appropriate. Quantitative variables (eg, age and all echocardiographic measurements) are expressed as mean ± standard deviation (SD).
Differences in quantitative variables between the groups were assessed using either the independent samples T-test for baseline characteristics and measurements or mixed linear model analysis with treatment groups as a factor and baseline values as a covariate. Comparisons of repeated measurements within each group performed with the mixed linear model analysis for repeated measures with the time of treatment as a factor. The degree of mitral regurgitation between time points was compared using the McNemar test, while the degree of paravalvular leak was evaluated between time points using the marginal homogeneity test. A significance level of P < .05 was chosen for all statistical tests.
Table 1 shows the demographic data for the 2 groups: TAVI was performed in 31 patients and SAVR in 34. Age was older in the TAVI group (P < .001) than in the SAVR group.
Table 1. Demographic data, comorbidities and percentage of different complications in the 2 procedures
| TAVI (31) | SAVR (34) | P | ||
|---|---|---|---|---|
| Age | Mean ± SD | 68.86 ± 2.61 | 66.00 ± 1.74 | < .001* |
| Sex | Female | 7 (22.6%) | 9 (26.5%) | .716 |
| Male | 24 (77.4%) | 25 (73.5%) | ||
| BMI | Mean ± SD | 32.71 ± 3.13 | 32.83 ± 2.76 | .893 |
| Comorbidities | Hypertension | 15 (48.4%) | 18 (52.9%) | .714 |
| Diabetes | 11 (35.5%) | 13 (38.2%) | .818 | |
| Dyslipidemia | 13 (41.9%) | 13 (38.2%) | .761 | |
| CVD | 7 (22.6%) | 12 (35.3%) | .260 | |
| Complications Clinical outcome | No | 22 (71.0%) | 30 (88.2%) | .082 |
| Conduction disturbance | 4 (12.9%) | 0 (0.0%) | .046* | |
| Acute kidney injury | 3 (6.4%) | 0 (0.0%) | .103 | |
| Neurological | 0 (0.0%) | 2 (5.9%) | .493 | |
| Vascular-related complications | 5 (16.1%) | 0 (0.0%) | .021* | |
| Rehospitalization | 1 (3.2%) | 2 (5.9%) | .999 | |
|
BMI, body mass index; CVD, cardiovascular disease; PPM, permanent pacemaker; SAVR, surgical aortic valve replacement; SD, standard deviation; TAVI, transcatheter aortic valve implantation. * Significant at P < .05. |
||||
The perioperative and postoperative course were uneventful in most patients, with reduced symptoms in both groups. However, several complications occurred during the periprocedural period and 1-year follow-up: 4 patients developed conduction abnormalities, presenting as complete heart block during their hospital stay and requiring the insertion of a dual-chamber permanent pacemaker; 3 patients developed contrast-induced nephropathy, which was corrected before discharge (2 of them had long-standing diabetes); 5 patients developed vascular complications in the form of mild to moderate bleeding from the access site, which did not require transfusion or intervention; and only 1 patient was readmitted due to hypertensive pulmonary edema (the patient had chronic uncontrolled hypertension) in the TAVI group. One patient died 10 days post-TAVI and was excluded.
In the SAVR group, 2 patients developed ischemic stroke due to ineffective anticoagulation and 2 others were readmitted due to warfarin toxicity complicated by gastrointestinal bleeding requiring admission for blood transfusion until the bleeding was controlled. None of the patients in this group developed acute renal injury, conduction abnormalities, or periprocedural vascular complications during their hospital stay (table 1).
In both groups, all echocardiographic variables were collected at baseline (before the procedure), and at 1 month, and 1 year postprocedure. These data are shown in table 2. A comparison of relative changes in each parameter at different evaluation times in the 2 groups is shown in table 3 and graphically represented in figure 1.
Table 2. Echo-Doppler parameters for the 2 procedures at each stage of assessment
| Variables | Baseline | 1 month | 1 year | |||||||
|---|---|---|---|---|---|---|---|---|---|---|
| TAVI | SAVR | P | TAVI | SAVR | P | TAVI | SAVR | P | ||
| LVEDD (cm) | 5.09 ± 0.32 | 5.15 ± 0.43 | .632 | 5.01 ± 0.33 | 5.13 ± 0.41 | .133 | 4.99 ± 0.29 | 4.95 ± 0.29 | .380 | |
| LVESD (cm) | 3.30 ± 0.28 | 3.51 ± 0.46 | .069 | 3.23 ± 0.28 | 3.50 ± 0.47 | .136 | 3.20 ± 0.22 | 3.27 ± 0.21 | .941 | |
| LVMI (g/m2) | 170.33 ± 14.10 | 169.17 ± 11.39 | .760 | 152.14 ± 13.28 | 169.63 ± 11.05 | < .001* | 138.81 ± 15.16 | 138.54 ± 17.03 | .952 | |
| LV sept (cm) | 1.53 ± 0.12 | 1.52 ± 0.10 | .707 | 1.44 ± 0.14 | 1.46 ± 0.13 | .107 | 1.21 ± 0.17 | 1.25 ± 0.13 | .280 | |
| LVEF % | 63.33 ± 5.86 | 57.44 ± 13.66 | .074 | 63.67 ± 6.05 | 59.71 ± 6.89 | .207 | 64.48 ± 5.12 | 62.54 ± 4.29 | .524 | |
| ESPAP (mmHg) | 30.00 ± 6.32 | 29.79 ± 8.06 | .924 | 27.14 ± 6.08 | 33.79 ± 7.49 | < .001* | 27.62 ± 6.21 | 28.54 ± 7.59 | .491 | |
| E/A | 0.63 ± 0.37 | 0.60 ± 0.39 | .801 | 0.65 ± 0.43 | 0.62 ± 0.39 | .899 | 0.67 ± 0.43 | 0.62 ± 0.38 | .504 | |
| E/e’ | 15.81 ± 2.84 | 14.13 ± 3.05 | .063 | 12.10 ± 1.92 | 14.21 ± 2.67 | < .001* | 10.10 ± 1.61 | 11.33 ± 1.90 | .007* | |
| TAPSE (cm) | 2.06 ± 0.26 | 2.14 ± 0.22 | .239 | 2.05 ± 0.26 | 1.67 ± 0.22 | < .001* | 1.97 ± 0.28 | 1.94 ± 0.23 | .199 | |
| AV-Vmax (m/s) | 4.92 ± 0.22 | 4.95 ± 0.24 | .655 | 1.64 ± 0.16 | 1.91 ± 0.15 | < .001* | 1.68 ± 0.16 | 1.85 ± 0.09 | < .001* | |
| AV-MG (mmHg) | 58.38 ± 7.17 | 58.08 ± 7.67 | .894 | 9.85 ± 1.65 | 13.23 ± 1.95 | < .001* | 9.21 ± 1.21 | 12.85 ± 1.93 | < .001* | |
| AVA-I (cm2/m2) | 0.47 ± 0.10 | 0.47 ± 0.10 | .984 | 1.20 ± 0.11 | 1.23 ± 0.07 | .358 | 1.22 ± 0.10 | 1.26 ± 0.08 | .201 | |
| LV-GLS % | −8.18 ± 1.81 | −8.30 ± 1.99 | .829 | −14.52 ± 2.52 | −8.82 ± 1.68 | < .001* | −16.57 ± 2.52 | −16.12 ± 2.69 | .511 | |
| MR degree | Mild | 26 (83.9%) | 21 (61.8%) | .057 | 28 (90.3%) | 23 (67.6%) | .028* | 27 (87.1%) | 21 (61.8%) | .020* |
| ≥ Moderate | 5 (16.1%) | 13 (38.3%) | 3 (9.7%) | 11 (32.4%) | 4 (12.9%) | 13 (38.2%) | ||||
| Degree of V or PV leak | None | − | − | 17 (54.8%) | 28 (82.4%) | .011* | 15 (48.4%) | 25 (73.5%) | .042* | |
| Mild | − | − | 12 (38.7%) | 6 (17.6%) | 13 (41.9%) | 8 (23.5%) | ||||
| ≥ Moderate | − | − | 2 (6.5%) | 0 (0.0%) | 3 (9.7%) | 1 (2.9%) | ||||
|
AVA-I, indexed aortic valve area; AV-MG, aortic valve mean pressure gradient; AV-Vmax, aortic valve maximum velocity; E/A, peak early diastolic mitral flow velocity/ late atrial diastolic mitral flow velocity; E/e’, peak early diastolic mitral flow velocity/ pulsed-wave tissue Doppler-derived early diastolic velocity from the septal mitral annulus ratio; ESPAP, estimated systolic pulmonary artery pressure; LVEDD, left ventricular end-diastolic dimension; LVEF, left ventricular ejection fraction; LVESD, left ventricular end-systolic dimension; LV-GLS, Left ventricular- global longitudinal strain; LVMI, left ventricular mass index; LV sept, left ventricular septal thickness; MR, mitral regurgitation; SAVR, surgical aortic valve replacement; TAPSE, tricuspid annular plane systolic excursion; TAVI, transcatheter aortic valve implantation; V or PV leak, valvular or paravalvular leak. * Significant at P < .05. Values are expressed as mean + standard deviation. |
||||||||||
Table 3. Comparison of repeated measurements at 1 month and 1year postintervention vs baseline measurements
| TAVI | SAVR | |||
|---|---|---|---|---|
| 1 month vs baseline P | 1 year vs baseline P | 1 month vs baseline P | 1 year vs baseline P | |
| LVED | .092 | .202 | .999 | .024* |
| LVESDD | .157 | .064 | .999 | .008* |
| LVMI | < .001* | < .001* | .999 | < .001* |
| LV sept | < .001* | < .001* | < .001* | < .001* |
| LVEF percentage | .999 | .430 | .736 | .110 |
| ESPAP | .001* | .036* | .005* | .752 |
| E/A | .768 | .117 | .406 | .761 |
| E/e’ | < .001* | < .001* | .999 | < .001* |
| TAPSE | .999 | .076 | < .001* | .002* |
| AV-VMAX | < .001* | < .001* | < .001* | < .001* |
| AV-MG | < .001* | < .001* | < .001* | < .001* |
| AVA-I | < .001* | < .001* | < .001* | < .001* |
| LV-GLS | < .001* | < .001* | .443 | < .001* |
| MR degree | .500 | 1.000 | .500 | 1.000 |
| - | - | 1 year vs 1 month P | - | 1 year vs 1 month P |
| Degree of V or PV leak | - | .083 | - | .046* |
|
AVA-I, indexed aortic valve area; AV-MG, aortic valve mean pressure gradient; AV-Vmax, aortic valve maximum velocity; E/A, peak early diastolic mitral flow velocity/late atrial diastolic mitral flow velocity; E/e’, peak early diastolic mitral flow velocity/pulsed-wave tissue Doppler-derived early diastolic velocity from the septal mitral annulus ratio; ESPAP, estimated systolic pulmonary artery pressure; LVEDD, left ventricular end-diastolic dimension; LVEF, left ventricular ejection fraction; LVESD, left ventricular end-systolic dimension; LV-GLS, left ventricular- global longitudinal strain; LVMI, left ventricular mass index; LV sept, left ventricular septal thickness; MR, mitral regurgitation; SAVR, surgical aortic valve replacement; TAPSE, tricuspid annular plane systolic excursion; TAVI, transcatheter aortic valve implantation; V or PV leak, valvular or paravalvular leak. P from mixed linear model analysis for repeated measures using time of treatment as a factor. * Significant at P < .05. |
||||
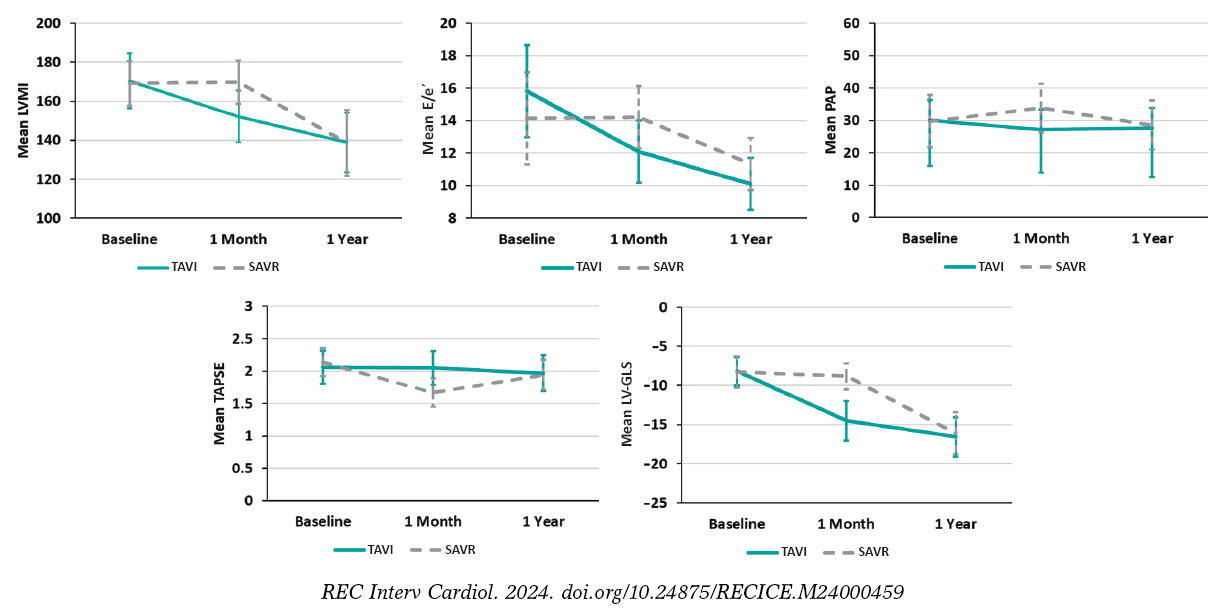
Figure 1. Relative changes of each parameter throughout the study from baseline to 1 year in both groups, with a relative decrease of LVMI, E/e, estimated systolic pulmonary artery pressure and relative increase in LV-GLS with no change in TAPSE shortly (1 month) after TAVI procedure vs no detectable changes in LVMI, E/e or LV-GLS and relative decrease in TAPSE and increase in estimated systolic pulmonary artery pressure in the SAVR group. At 1 year, the parameters were nearly equivalent in the 2 groups. E/e’, peak early diastolic mitral flow velocity/ pulsed-wave tissue Doppler-derived early diastolic velocity from the septal mitral annulus ratio; LV-GLS, left ventricular-global longitudinal strain; LVMI, left ventricular mass index; PAP, pulmonary artery pressure; SAVR, surgical aortic valve replacement; TAPSE, tricuspid annular plane systolic excursion; TAVI, transcatheter aortic valve implantation.
All baseline echocardiographic variables were comparable between the 2 groups.
After both procedures, there was a significant improvement in aortic valve maximum velocity (AV-Vmax), aortic valve mean pressure gradient (AV-MG), and aortic valve area (AVA) (P < .001 for all). This improvement persisted throughout the year, while a relatively more pronounced early and 1-year improvement in AV-Vmax and AV-MG (P < .001 for both) were observed in the TAVI vs the SAVR group. None of the patients in either group developed patient prosthetic mismatch.
There was a steady and significant improvement in LV septal thickness postprocedure in both groups at different evaluation times. There was also a slight but significant improvement in LV dimensions (LV end-diastolic dimension and LV end-systolic dimension) in the SAVR group at 1 year compared with the TAVI group. Specifically, LV end-diastolic dimension decreased from 5.15 ± 0.43 to 4.95 ± 0.29 (P = .024) in the SAVR group vs 5.09 ± 0.32 to 4.99 ± 0.29 (P = .202) in the TAVI group. Similarly, LV end-systolic dimension decreased from 3.51 ± 0.46 to 3.27 ± 0.21 (P = .008) in the SAVR group vs 3.30 ± 0.28 to 3.20 ± 0.22, P = .064 in the TAVI group.
A favorable early outcome was observed in the TAVI group, with a significant decrease in LV mass index and E/e’ shortly after the procedure that persisted at 1 year. LV mass index decreased from 170.33 ± 14.10 to 152.14 ± 13.28 (P < .001) in the TAVI group vs 169.17 ± 11.39 to 169.63 ± 11.05 (P = .999) in the SAVR group. E/e’ decreased from 15.81 ± 2.84 to 12.10 ± 1.92 (P < .001) in the TAVI group vs 14.13 ± 3.05 to 14.21 ± 2.67 (P = .999) in the SAVR group (figure 1).
Although mitral valve regurgitation showed a relative improvement in the TAVI group compared with the SAVR group at 1 month (P = .028) and 1 year of follow-up (P = .020), it did not significantly change within each group at different evaluation times. Mild mitral regurgitation was prevalent in both groups.
There was no significant change in tricuspid annular plane systolic excursion postprocedure in the TAVI group. However, in the SAVR group it significantly decreased shortly after the procedure from 2.14 ± 0.22 to 1.67 ± 0.22 (P < .001). As shown in figure 1, estimated systolic pulmonary artery pressure showed a significant reduction from 30.00 ± 6.32 to 27.14 ± 6.08 (P = .001) shortly after TAVI but was significantly increased from 29.79 ± 8.06 to 33.79 ± 7.49 after SAVR (P = .005).
There was a statistically significant difference between the 2 groups (P < .001), favoring the TAVI group with an early detectable improvement of LV-GLS from −8.18 ± 1.81 to −14.52 ± 2.52, P < .001 at 1 month, reaching −16.57 ± 2.52 at 1 year. In contrast, this early improvement was not observed in the SAVR group, with the first detectable improvement being observed at 1 year (−8.30 ± 1.99 to −16.12 ± 2.69; P < .001) (figure 2).
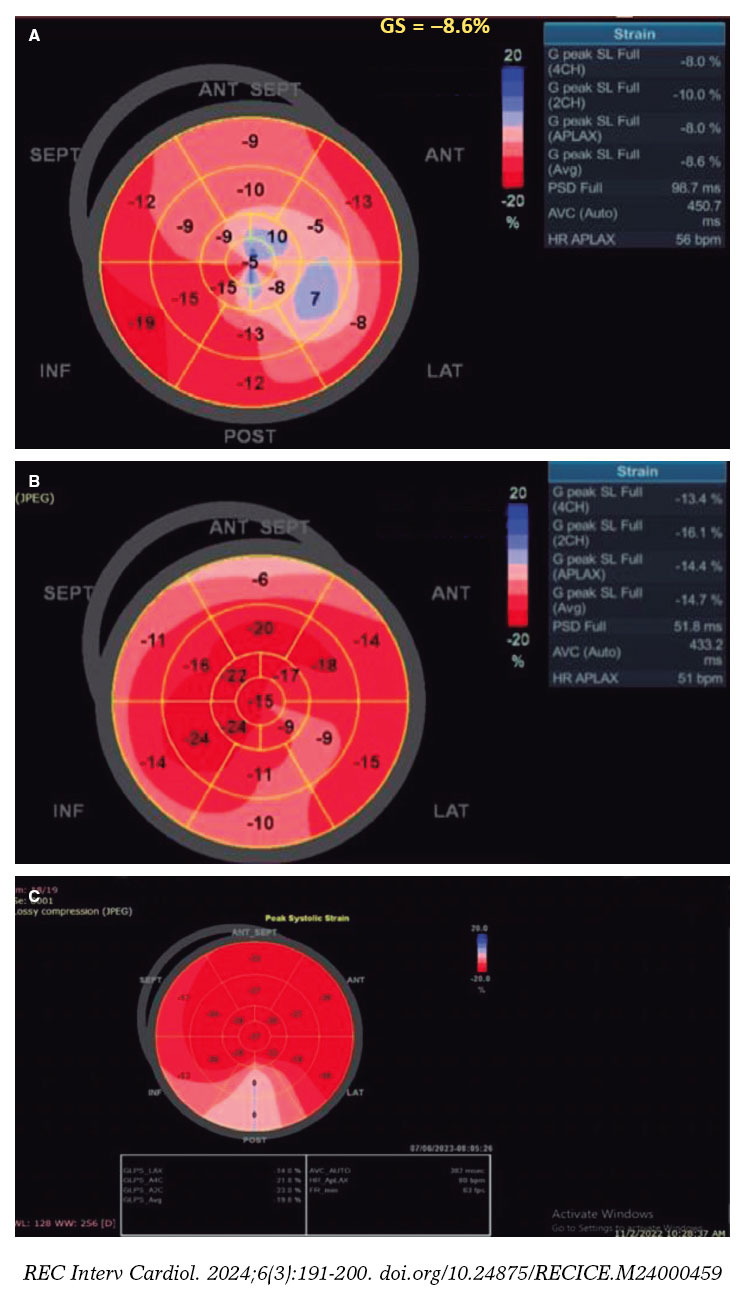
Figure 2. A, baseline: low LV-GLS before TAVI. B, 1 month after the procedure, LV-GLS significantly increased from −8.6 to −14.7. C, 1 year after TAVI, LV-GLS continued to improve from −14.7 to −19.8. SEPT, septal; ANT, anterior; ANT SEPT, anteroseptal; INF, inferior; POST, posterior; LAT, lateral.
In the TAVI group, more patients developed mild or ≥ moderate paravalvular leak, with 12 (38.7%) and 2 (6.5%) patients, respectively, at immediate follow-up. These numbers increased to 13 (41.9%) and 3 (9.7%) patients, respectively, at 1 year. In the SAVR group, none developed ≥ moderate paravalvular leak, and only 6 (17.6%) patients had mild nonsignificant paravalvular leak at 1 month. Only 1 patient progressed from mild to moderate paravalvular leak at 1 year, with a statistically significant difference between the 2 groups (P = .011 at 1 month and P = .042 at 1 year).
The correlation coefficient for interobserver reproducibility of LV-GLS was 0.933 (95% confidence interval [95%CI]: 0.894-0.957), and that for intraobserver agreement was approximately 0.985 (95%CI, 0.976-0.991).
Echocardiography is the most effective approach for evaluating prosthetic valve performance, prosthesis-related complications, chamber geometry, remodeling, and cardiac function after any valve intervention, whether surgical or transcatheter.
Our study included all surgical risk categories. Whenever possible, TAVI was the preferred strategy for aortic valve replacement to increase our center’s experience, unless contraindicated after heart team discussion (eg, inadequate annulus size, LV thrombus, asymmetric valve calcification, short distance between annulus and coronary ostium, inadequate vascular access, mobile thrombi in the arch or ascending aorta, bicuspid valve, concomitant significant valvular or coronary artery diseases requiring intervention, or due to unlikely improvement in quality of life after TAVI because of associated comorbidities). TAVI was found to be noninferior to SAVR regarding postoperative improvement in symptoms and enhanced valve hemodynamics with improvement of AV-Vmax, AV-mean pressure gradient, and indexed aortic valve area, and even greater improvement in AV-Vmax and AV-mean pressure gradient during short- and long-term follow-up. These findings are supported by the recent update of the guidelines on indications for TAVI,14 which have firmly established this approach as an alternative to SAVR in the treatment of AS in all surgical risk categories after the continued evolution of TAVI and the results of multiple randomized trials.
The major pathophysiological features of AS are increased afterload, LV remodeling, increased filling pressure, LV diastolic dysfunction, and heart failure symptoms. The diastolic dysfunction occurs earlier and is followed by an increase in LV mass.15 After TAVI, there are immediate marked reductions in transvalvular pressure gradients, which translate into an immediate decrease in LV afterload, with an increase in E and e’ that reflects early diastolic relaxation after TAVI compared with SAVR.
After SAVR, transient perioperative LV dysfunction related to cardiopulmonary bypass is a well-known factor that can adversely affect LV remodeling.16 This transient LV dysfunction is associated with elevated biochemical markers, such as brain natriuretic peptides and troponin I soon after SAVR.17,18 However, these consequences of cardiopulmonary bypass are absent after TAVI. Therefore, LV remodeling can be reduced shortly after the procedure due to less neurohormonal stimulation, which helps to improve preprocedure LV hypertrophy.16
Even with preserved systolic LV function after postcardiac surgery, the degree of the E/e’ ratio has been shown to strongly correlate with brain natriuretic peptide levels. Consequently elevated left atrial pressure and diastolic dysfunction are major determinants of the release of brain natriuretic peptides in clinical settings.19 The present study therefore highlights how the early recovery of LV filling pressure, as indicated by earlier reduction in AV-Vmax, AV-MG, E/e’ ratio, and LV mass index can positively affect LV remodeling. This translates into early improvement of LV-GLS deformation parameters even without significant changes in LVEF percentage after TAVI. These phenomena can help explain the evidence of better short-term prognosis in patients with severe AS undergoing TAVI.20 At the 1-year follow-up, the initial mechanisms responsible for such better early outcomes were absent, and consequently the distribution of alterations in diastolic function in the SAVR group was comparable to that in the TAVI group.15
Mitral valve regurgitation did not appear to be significantly affected within the same group at different evaluation times but was improved in the TAVI group compared with the SAVR group.
These results contrast with previously published data from Gonçalves et al.21 Although these authors calculated parameters of LV diastolic function before and minutes after TAVI, they did not include a comparison with a surgical group. They found a significant increase in E-wave deceleration time, E-wave velocity, and a marked decrease in LV end-diastolic pressure.
Additionally, Jin Ha et al.22 compared the effect of TAVI vs SAVR immediately and 3 months after aortic valve replacement on LV function and diastolic parameters. They found that more patients showed improvement in LV diastolic function grade in the TAVI than in the SAVR group (42% vs 11%). Early improvement in diastolic function grade with a significant decrease in E/e’ ratio and estimated systolic pulmonary artery pressure was seen immediately in the TAVI group. Similar to our study, LV end-diastolic dimension and LV end-systolic dimension were significantly changed at 3 months after SAVR. This result could be explained by the frequent use of diuretics following surgery to manage pleural effusion and possible pulmonary edema. In contrast, mitral valve regurgitation did not differ significantly between the groups, and LV mass index did not show an immediate significant change in either group and started to decrease after 3 months.
Guarracino et al.,16 evaluated brain natriuretic peptides and LV diastolic function by mitral flow propagation velocity and mitral annulus early diastolic velocity, before and after valve procedures, and recorded improvement of LV diastolic parameters in the TAVI group with an increase in brain natriuretic peptides in the surgical group.
Similarly, Fairbairn et al.23 reported early regression in mass and reverse LV remodeling after TAVI compared with SAVR.
In contrast, Ngo et al.24 compared patients undergoing SAVR vs TAVI at 3 and 12 months and found a similar reduction in relative wall thickness in both groups and a more marked reduction in LV mass index in patients undergoing SAVR (17.5% vs 7.2%; P < .001).
In our study, patients who underwent TAVI showed little change in right ventricular function, with no change in tricuspid annular plane systolic excursion or further increase in estimated systolic pulmonary artery pressure compared with those who underwent SAVR. Kempny et al.25 confirmed that TAVI did not influence right ventricular function, but that it worsened in patients undergoing SAVR.
Increased LV mass and the higher relative wall thickness generated by increased LV afterload in patients with severe AS are associated with reduced LV regional and global myocardial deformation assessed by 2D speckle tracking echocardiography. Therefore, LV-GLS can accurately assess LV myocardial contractility and can detect subclinical changes in LV performance in patients with AS,26 which improves after aortic valve replacement.27
Several studies have shown that TAVI is associated with a significant early improvement in LV strain parameters28-30 and that this such improvement is associated with a more favorable prognosis.25 Similar to our study, LV-GLS significantly improved immediately after TAVI while ejection fraction failed to show such a change.
Tsampasian et al.31 assessed LV-GLS before and after TAVI in 85 patients, with a mean follow-up of 49 ± 39 days. TAVI resulted in an early significant improvement of GLS (from −13.96 to −15.25, P = .01) as well as early LV mass regression with no change in ejection fraction percentage. The type of valve had no effect on LV function or remodeling after TAVI.
Mild or persistent moderate paravalvular leak is a known predictor of poor outcomes after TAVI.32 However, in our study, although more patients developed significant paravalvular leak after TAVI compared with SAVR in both short- and long-term follow-up, LV-GLS improved shortly after TAVI. This finding is supported by those of Kampaktsis et al.,33 who studied the impact of paravalvular leak on LV remodeling and LV-GLS and reported significant improvement in LV-GLS regardless of paravalvular leak, at the same time as it negatively affected LVEF percentage, LV mass regression, and diastolic function. A small number of our included patients could have negatively affected the statistical power of these findings. Patients predominantly with aortic regurgitation, or severe LV dysfunction (EF < 35%) were excluded to eliminate the adverse effect of such confounding factors on LV remodeling.
This study has some limitations. The first is the small sample size due to the limited number of TAVI patients in our center at enrolment. A larger sample size would have enhanced the statistical power and generalizability of the findings. Second, this is a single-center study with a lack of randomization, which could introduce selection bias and potentially affect the validity of the comparison between the 2 procedures. Third, we did not study other confounding factors affecting postoperative LV remodeling, such as hypertension, renal impairment, and baseline ventricular dysfunction. Fourth, the study reported follow-up data at 1 month and 1 year after the procedure. Longer-term follow-up would provide a more comprehensive understanding of LV remodeling outcomes.
Compared with individuals who underwent SAVR, those undergoing TAVI had earlier improvement of LV remodeling and LV diastolic function, with early reduction in LV mass index, E/e’ ratio, and significant early improvement of LV-GLS without concomitant changes in LVEF percentage, while maintaining right ventricular function. Nevertheless, these patients also showed rapid valve deterioration and a higher incidence of valvular and paravalvular leak. More TAVI patients experienced complete atrioventricular block, requiring permanent pacemaker implantation, and vascular complication related to the access site.
This study did not receive any specific grant from funding agencies in the public, commercial, or not-for-profit sectors.
Written informed consent was obtained from all study participants. The study was approved by the local Ethics Committee at the Faculty of Medicine, Tanta University (approval code: 36264PR12/1/23). Sex and gender variables were not taken into account in accordance with SAGER guidelines.
No artificial intelligence was used in the preparation of this manuscript.
S.B. El-Saied: design of the study, performing echocardiography for patients, and drafting the manuscript. R. Atlm and M. Elbarbary: data acquisition and analysis and revision of the manuscript and the results. A. Ghoneim and M.H. Sherif: contributed to manuscript drafting, data acquisition and analysis, and revision of the manuscript and the results. S.B. El-Saied, R. Atlm, A. Ghoneim, M.H. Sherif, and M. Elbarbary revised the work and approved the final version to be published.
The authors declare that they have no competing interests.
1. Thaden JJ, Nkomo VT, Enriquez-Sarano M. The global burden of aortic stenosis. Prog Cardiovasc Dis. 2014;56:565-571.
2. Leon MB, Smith CR, Mack MJ, et al. Transcatheter or surgical aortic-valve replacement in intermediate-risk patients. N Engl J Med. 2016;374:1609-1620.
3. Kodali SK, Williams MR, Smith CR, et al. Two-year outcomes after transcatheter or surgical aortic-valve replacement. N Engl J Med. 2012;366:1686-1695.
4. Leon MB, Smith CR, Mack MJ, et al. Transcatheter or Surgical Aortic-Valve Replacement in Intermediate-Risk Patients. N Engl J Med. 2016;374:1609-1620.
5. Wenaweser P, Stortecky S, Schwander S, et al. Clinical outcomes of patients with estimated low or intermediate surgical risk undergoing transcatheter aortic valve implantation. Eur Heart J. 2013;34:1894-1905.
6. Popma JJ, Deeb GM, Yakubov SJ, et al. Transcatheter aortic-valve replacement with a self-expanding valve in low-risk patients. N Engl J Med. 2019;380:1706-1715.
7. Mack MJ, Leon MB, Thourani VH, et al. Transcatheter aortic-valve replacement with a balloon-expandable valve in low-risk patients. N Engl J Med. 2019;380:1695-1705.
8. Hein S, Arnon E, Kostin S, et al. Progression from compensated hypertrophy to failure in the pressure-overloaded human heart:structural deterioration and compensatory mechanisms. Circulation. 2003;107:984-991.
9. Nishimura RA, Otto CM, Bonow RO, et al. 2017 AHA/ACC focused update of the 2014 AHA/ACC guideline for the management of patients with valvular heart disease:a report of the American College of Cardiology/American Heart Association Task Force on Clinical Practice Guidelines. Circulation. 2017;135:e1159-e1195.
10. Reisner SA, Lysyansky P, Agmon Y, Mutlak D, Lessick J, Friedman Z. Global longitudinal strain:a novel index of left ventricular systolic function. J Am Soc Echocardiogr. 2004;17:630-633.
11. Popma JJ, Adams DH, Reardon MJ, et al. Transcatheter aortic valve replacement using a self-expanding bioprosthesis in patients with severe aortic stenosis at extreme risk for surgery. J Am Coll of Cardiol. 2014;63:1972-1981.
12. Lang RM, Badano LP, Mor-Avi V, et al. Recommendations for cardiac chamber quantification by echocardiography in adults:an update from the American Society of Echocardiography and the European Association of Cardiovascular Imaging. J Am Soc Echocardiogr. 2015;16:233-271.
13. Notomi Y, Shiota T, Popovic´ZB, et al. Measurement of ventricular torsion by two-dimensional ultrasound speckle tracking imaging. J Am Coll Cardiol. 2005;45:2034-2041.
14. Sundt TM, Jneid H. Guideline update on indications for transcatheter aortic valve implantation based on the 2020 American College of Cardiology/American Heart Association guidelines for management of valvular heart disease. JAMA Cardiol. 2021;6:1088-1089.
15. Douglas PS, Berko B, Lesh M, Reichek N. Alterations in diastolic function in response to progressive left ventricular hypertrophy. J Am Coll Cardiol. 1989;13:461-467.
16. Guarracino F, Talini E, Landoni G, Petronio S, Giannini C, Di Bello V. Effect of aortic valve surgery on left ventricular diastole assessed by echocardiography and neuroendocrine response:percutaneous versus surgical approach. J Cardiothorac Vasc Anesth. 2010;24:25-29.
17. Provenchère S, Berroeta C, Reynaud C, et al. Plasma brain natriuretic peptide and cardiac troponin I concentrations after adult cardiac surgery:association with postoperative cardiac dysfunction and 1-year mortality. Crit Care Med. 2006;34:995-1000.
18. Rieck ÅE, Gerdts E, Lønnebakken MT, et al. Global left ventricular load in asymptomatic aortic stenosis:covariates and prognostic implication (the SEAS trial). Cardiovasc Ultrasound. 2012;10:1-8.
19. Salustri A, Cerquetani E, Piccoli M, et al. Relationship between B-type natriuretic peptide levels and echocardiographic indices of left ventricular filling pressures in post-cardiac surgery patients. Cardiovasc Ultrasound. 2009;7:1-7.
20. Bleiziffer S, Ruge H, Mazzitelli D, et al. Survival after transapical and transfemoral aortic valve implantation:talking about two different patient populations. J Thoracic Cardiovasc Surg. 2009;138:1073-1080.
21. Gonçalves A, Marcos-Alberca P, Almeria C, et al. Acute left ventricle diastolic function improvement after transcatheter aortic valve implantation. Eur J Echocardiogr. 2011;12:790-797.
22. Ha SJ, Yoo SY, Hong MK, Hong GR. Immediate and evolutionary recovery of left ventricular diastolic function after transcatheter aortic valve replacement:comparison with surgery. Yonsei Med J. 2020;61:30.
23. Fairbairn TA, Steadman CD, Mather AN, et al. Assessment of valve haemodynamics, reverse ventricular remodelling and myocardial fibrosis following transcatheter aortic valve implantation compared to surgical aortic valve replacement:a cardiovascular magnetic resonance study. Heart. 2013;99:1185-91.
24. Ngo A, Hassager C, Thyregod HGH, et al. Differences in left ventricular remodelling in patients with aortic stenosis treated with transcatheter aortic valve replacement with corevalve prostheses compared to surgery with porcine or bovine biological prostheses. Eur Heart J Cardiovasc Imaging. 2018;19:39-46.
25. Kempny A, Diller GP, Kaleschke G, et al. Impact of transcatheter aortic valve implantation or surgical aortic valve replacement on right ventricular function. Heart. 2012;98:1299-304
26. Weideman F, Jamal F, Kowalski M, et al. Can strain rate and strain quantify changes in regional systolic function during dobutamine infusion, B-blockade, and atrial pacing—implications for quantitative stress echocardiography. J Am Soc Echocardiogr. 2002;15:416-424.
27. Delgado V, Tops LF, van Bommel RJ, et al. Strain analysis in patients with severe aortic stenosis and preserved left ventricular ejection fraction undergoing surgical valve replacement. Eur Heart J. 2009;30:3037-3047.
28. Giannini C, Petronio AS, Talini E, et al. Early and late improvement of global and regional left ventricular function after transcatheter aortic valve implantation in patients with severe aortic stenosis:an echocardiographic study. Am J Cardiovasc Dis. 2011;1:264-273.
29. Kempny A, Diller GP, Kaleschke G, et al. Longitudinal left ventricular 2D strain is superior to ejection fraction in predicting myocardial recovery and symptomatic improvement after aortic valve implantation. Int J Cardiol. 2013;167:2239-2243.
30. Schattke S, Baldenhofer G, Prauka I, et al. Acute regional improvement of myocardial function after interventional transfemoral aortic valve replacement in aortic stenosis:A speckle tracking echocardiography study. Cardiovasc Ultrasound. 2012;10:15.
31. Tsampasian V, Panoulas V, Jabbour RJ, et al. Left ventricular speckle tracking echocardiographic evaluation before and after TAVI. Echo Res Pract. 2020;7:29-38.
32. SáMP, Jacquemyn X, Van den Eynde J, et al. Impact of Paravalvular Leak on Outcomes After Transcatheter Aortic Valve Implantation:Meta-Analysis of Kaplan-Meier-derived Individual Patient Data. Struct Heart. 2023;7:100118.
33. Kampaktsis PN, Subramayam P, Sherifi I, et al. Impact of paravalvular leak on left ventricular remodeling and global longitudinal strain 1 year after transcatheter aortic valve replacement. Future Cardiology. 2021;17:337-345.
* Corresponding author.
E-mail address: mohammed.elbarbary@med.tanta.edu.eg (M. Elbarbary).

Introduction and objectives: Coronary computed tomography angiography (CCTA) has become the gold standard to measure the size of the aortic annulus and better select the size of transcatheter heart valves (THV) in patients undergoing transcatheter aortic valve implantation (TAVI). However, in selected cases, CCTA may not be feasible. Angiographic aortic annulus (AAA) measurements during TAVI may be an alternative and should be evaluated for precision regarding the proper selection of THV sizes. We sought to investigate the correlation between AAA and CCTA measurements for the proper selection of balloon-expandable valve (BEV) sizes in patients undergoing TAVI.
Methods: Patients undergoing TAVI with BEV and high-quality CCTA were included. AAA measurements were obtained in the standard 3-cusp view after aortic root aortography. Angiographic distance between non- and left coronary cusps were compared to CCTA annulus measurements. Endpoints were diagnostic tests and correlations between angiographic and CCTA measurements, and the composite endpoint of the VARC-3-defined efficacy (technical success, correct position, and intended performance), and safety profile (multiple valves, valve embolization, pacemaker implantation, and more than moderate valvular regurgitation).
Results: Regarding the Sapien family of THV, aortography-based distance measurements showed a correlation of 0.528 (P < .01), 0.451 (P < .01), and 0.579 (P < .01) for 23 mm, 26 mm, and 29 mm valves with CCTA-based distance measurements. No difference was seen regarding the VARC-3-defined efficacy (94.2% vs 96.0%; P = .60) and safety profile (90.9% vs 91.9%; P = .84) among cases showing discordant and concordant pairs of measurements.
Conclusions: AAA measurement showed a moderate diagnostic test and Spearman’s correlation coefficient compared to CCTA-based annulus assessment for perioperative THV size selection. This strategy could potentially enable TAVI in patients in whom access to preoperative CCTA is not available.
Keywords: Non-coronary cusp. Left coronary cusp. Aortography. Angiographic aortic annulus measurements. Transcatheter aortic valve implantation.
Introducción y objetivos: La angiografía por tomografía computarizada (angio-TC) es el estándar para medir el anillo aórtico en pacientes tratados mediante implante percutáneo de válvula aórtica (TAVI), aunque en algunos casos podría no ser factible. Debería evaluarse la precisión de las medición del anillo aórtico angiográfica (AAA) durante el TAVI como alternativa para elegir el tamaño correcto de la válvula cardiaca percutánea. Por ello, investigamos la correlación entre las mediciones angiográficas y por angio-TC para elegir el tamaño adecuado de la válvula en pacientes que reciben un TAVI.
Métodos: Se incluyeron pacientes de TAVI con prótesis de balón expandible y angio-TC de alta calidad. Las mediciones del AAA se obtuvieron de la angiografía de la raíz aórtica en proyección de 3 cúspides. Se comparó la distancia angiográfica entre la cúspide izquierda y no coronariana con las mediciones de angio-TC. Se evaluaron la prueba diagnóstica y la correlación entre las medidas angiográficas y de angio-TC, así como la eficacia (éxito técnico, posición correcta y desempeño intencionado) y la seguridad (múltiples válvulas, embolización, implante de marcapasos e insuficiencia valvular moderada o mayor) definida por VARC-3.
Resultados: Para válvulas con balón expandible de 23 mm, la distancia en la aortografía tuvo una correlación de 0,528 (p < 0,01) comparada con las mediciones de angio-TC; para las de 26 mm, la correlación fue de 0,451 (< 0,01), y para las de 29 mm fue de 0,579 (< 0,01). No hubo diferencia en cuanto a eficacia (94,2 frente a 96,0%; p = 0,60) y seguridad (90,9 frente a 91,9%; p = 0,84) entre casos con medidas concordantes y discordantes.
Conclusiones: Las mediciones del AAA mostraron un moderado valor de prueba diagnóstica y de correlación Spearman en comparación con la angio-TC para elegir el tamaño de la válvula cardiaca percutánea. Esta estrategia podría permitir un TAVI en situaciones en que la angio-TC no esté disponible.
Palabras clave: Cúspide no coronariana. Cúspide coronaria izquierda. Aortografía. Mediciones angiográficas del anillo aórtico. Implante percutáneo de válvula aórtica.
Abbreviations
BEV: balloon-expandable valve. CCTA: coronary computed tomography angiography. LCC: left coronary cusp. NCC: non-coronary cusp. TAVI: transcatheter aortic valve implantation. THV: transcatheter heart valve.
During transcatheter aortic valve implantation (TAVI), coronary computed tomography angiography (CCTA) remains the key factor to determine the characteristics of the aortic valve and predefine the size of annular valve prior to the selection of specific transcatheter heart valves (THV).1,2 Several CCTA protocols were described to achieve reproducible and reliable aortic annulus measurements.3,4 At the same time, transthoracic and transesophageal echocardiographic measurements were used to determine the aortic valve annular size showing good correlation with the gold standard of direct surgical and CCTA-based measurements.5,6 However, CCTA showed better image quality acquisition, detailed evaluation of the aortic annulus, and other useful anatomies for transfemoral TAVI (aorto-iliac-femoral vessels)7 making CCTA the default strategy for preoperative planning.
Adequate THV size selection is an important factor to prevent patient-prosthesis mismatch and reduce the risk of over- and under-sizing and, hence, the increased risk of all cause-mortality and unplanned repeat reintervention.6,8,9 While CCTA has been established as the gold standard method for annular sizing pre-TAVI implantation,4 an associated risk between radiation exposure and cancer, and contrast media and nephropathy has also been described.10,11 Furthermore, in selected cases, CCTA may not be feasible prior to TAVI following emergency clinical indications and/or the patients’ unstable conditions.
Aortography-only annular measurement was described as an efficient technique to determine the size of aortic annulus and select the size of the THV.12,13 Based on the standard 3-cusp view, the angiographic determination of anatomical dimensions with contrast media (and/or balloon-sizing) can facilitate the identification of proper annular size when CCTA-based sizing is not available.14-17 Aortography-based measurements have been shown to correlate with direct anatomical preoperative aortic annulus measurements.13
Against this background, we sought to investigate whether angiographic aortic valve annular measurements between the non-coronary (NCC) and left coronary cusp (LCC) correlate with CCTA-based measurements to facilitate proper size selection of the THV in a retrospective, all-comers, single-center cohort of patients undergoing TAVI.
This retrospective, observational analysis evaluated all consecutive patients undergoing transfemoral TAVI following heart team evaluation at the German Heart Center cardiovascular disease unit in Munich, Germany. Transfemoral TAVI was performed using a minimalistic approach18 in all cases, while THV size selection was left to the operator’s discretion based on size chart, CCTA measurements, anatomical factors including calcium distribution and severity, aortic valve annular size, coronary height, and disease.
All patients with native tricuspid calcified aortic valve disease, and available high-quality CCTA for TAVI were included in this study. Procedural information was obtained from a customized database and screened for all patients treated from January 2014 through December 2021 at the German Heart Center in Munich, Germany. During this period, a total of 2500 transfemoral TAVI cases were performed using commercially available balloon-expandable (1865) and self-expanding (635) THVs. Only those who received the SAPIEN 3 or the SAPIEN 3 Ultra (Edwards Lifesciences, United States) balloon-expandable valves (BEV) were included in this analysis.
The study was performed in full compliance with the principles set forth in the Declaration of Helsinki, and all patients gave their written informed consent to undergo the procedure. Ethical approval was obtained from the Technical University of Munich ethical committee under registry no. OBSERVTAVI (#525/17). CCTA measurements were performed before THV implantation. Angiographic aortic valve annular measurements between the NCC and LCC were performed offline and documented in the database. The baseline clinical and procedural characteristics (including size of the implanted THV and angiographic aortic regurgitation after implantation), and test lab results were obtained from registry data or the clinical records, as appropriate. Regarding the Valve Academic Research Consortium 3 (VARC-3) defined safety and efficacy profile, in-hospital and discharge follow-up was monitored and registered. A 30-day follow-up was established via telephone call, hospital visits or follow-up letter.
CCTA was analyzed by 1 experienced cardiologist (HA) while a second experienced cardiologist (JM) analyzed a sample of 40 cases to determine inter-observer variability. Using multi-slice computed tomography reconstruction, quantitative measures of the aortic valve annular size (minimum, maximum and mean diameter, perimeter, and area) were obtained based on predefined protocols2 using 3-Mensio software (Pie Medical Imaging, The Netherlands). In summary, the 3 hinge points of the aortic cusps were detected and selected. After proper identification of the 3 hinge points, the aortic annulus was seen in automatic multiplanar reconstruction. Annular measurements were obtained 0.5 mm below the hinge points, and the aortic valve annular contour was traced to calculate the perimeter-derived area and diameter (figure 1A). To define the direct one-planar measurement between the NCC and the LCC on the CCTA, a straight line between the red (LCC) and yellow (NCC) hinge points was used to determine length (figure 1B,C). The most appropriate THV size was selected based on size chart recommendations and anatomical considerations (figure 1D). CCTA-based measurements and calculations were used to determine the proper THV size according to commercial size charts supplied by the manufacturer. The mean diameter and area of the aortic annulus were used to select the THV size (23 mm, 26 mm, and 29 mm) and then coded as a binary variable for each size category; when only 1 measurement was within the proposed range for a specific THV size based on the manufacturer’s size chart (within the gray zone), the area was used to decide the final THV size.

Figure 1. Central illustration. A: aortic annulus CCTA measurements determining the minimum (19.6 mm), maximum (25.9 mm), and mean (22.8 mm) diameter, perimeter (73 mm), and area (394 mm2). B: CCTA measurement from the lowest point between the left coronary cusp (red dot) and the non-coronary cusp (yellow dot) with a 23.0 mm distance. C: CCTA prediction of angiographic angulation to obtain the standard 3-cusp view (cranial right anterior oblique view of first and seventh nerves) with the left-coronary cusp from 1 side (red dot) and the non-coronary cusp on the other side (yellow dot), and the distance between them (23.0 mm). D: angiographic result after balloon-expandable valve implantation based on the tomographic measurements shown on figure 1 A (SAPIEN 3 Ultra 23 mm).
All procedures were performed by experienced TAVI operators using a monoplane digital flat panel detector X-ray system (Allura Xper FD 10 C, Royal Philips, The Netherlands) in a dedicated hybrid cath lab. All fluoroscopic 3-cusp view images were analyzed after completion of the procedure and images with distance measurements saved. Angiographic measurements were obtained offline from the angiographic aortic root injection (native annulus without the implanted THV) using a 5-Fr pigtail catheter placed in the right coronary cusp in the standard 3-cusp view.14,15 The distance between the NCC and LCC hinge points was measured by experienced cardiologists (HA and JM) using dedicated Phillips software (figure 2A-H). Angiographic measurements were performed after automatic (based on calibration factor determined by the software) and manual (using the 5-Fr catheter as reference calibration factor) calibration to determine the distance in millimeters.

Figure 2. A: standard 3-cusp cranial right anterior oblique view of first and seventh nerves (red circle) to determine longitudinal measurement (yellow arow) in the best contrasted image (green circle). B: calibration option based on the best image available (yellow arrow). C: measurement option (red arrow) to determine the distance on the aortic annulus (yellow size) on the images saved (green circle). D: saved image (red arrow) to “start analysis” (yellow arrow). E: manual calibration based on the 5-Fr catheter (red arrow and arrowhead) drawing 2 lines over the catheter (red circle) comparing the calibration factor given by the software (0.1451 mm/pixels, yellow arrow) to the one obtained through manual calibration (0.1486 mm/pixels, yellow arrowhead). F: “longitudinal measurement” option should be selected (red arrow) drawing a line at the hinge point of the left and non-coronary cusp (red circle). G: for automatic calibration, select “accept automatic calibration” (yellow arrow); the calibration factor given by the software (0.1451 mm/pixels) will be used for measurement purpose (yellow arrowhead, calibration factor of 0.1451 mm/pixels). H: aortic valve annulus measurement using automatic calibration selecting “longitudinal measurement” (red arrow) and drawing a line between the hinge points of the left and non-coronary cusp (red circle).
Endpoints were the correlation between angiographic and CCTA measurements of the distance between the NCC and the LCC. The rates of the VARC-3-defined efficacy (technical success, correct position, and intended performance using VARC-319 definitions) and safety profile (multiple valves, valve embolization, pacemaker implantation, and more than moderate valvular regurgitation using VARC-3 definitions) in patients with concordant and discordant measurements between angiographic and CT-based measurements were also analyzed.
Rates of in-hospital complications defined as conversion to surgery, perioperative death, life-threating bleeding, major and minor bleeding, major and minor vascular complications, and in-hospital mortality in patients with concordant and discordant measurements were reported. The 30-day mortality rate, chronic heart failure, stroke, valve dysfunction, aortic mean gradient, and aortic regurgitation were reported too.
Categorical variables were expressed as frequencies and proportions and compared using the chi-square test or Fisher’s exact test, as appropriate. Continuous data were tested for normality with the Shapiro-Wilk test and expressed as mean (± standard deviation) or median (interquartile range [IQR]) as appropriate, and then compared, respectively, using the unpaired t test or the Mann-Whitney U test.
The study population was divided into derivation (n = 1256), and validation cohort (n = 40 cases). The study group of interest was obtained from the derivation cohort (n = 393). In the derivation cohort, selection of specific THV sizes (23 mm, 26 mm, and 29mm) based on the gold standard CCTA assessment was categorized as a binary variable and then compared to the THV size selection derived from aortography. Subsequently, logistic regression analysis was performed using the binary variable from the CCTA-based THV selection as a dependent variable while aortographic distance measurements were considered an independent variable. Afterwards, the receiver operating characteristic (ROC) curve was analyzed to identify optimal cut-off criteria (distance in mm, Youden’s index) and determine individual diameter ranges based on aortographic distance measurements of each category of THV sizes. The lowest value from the smallest THV and the highest value from the largest THV was determined using the 25th and 75th IQR, respectively, taken from the distribution of the derivation population. The suggested THV size was derived using aortography with manual or automatic calibration. Sensitivity, specificity, positive, and negative predictive values, as well as positive and negative likelihood were used to determine diagnostic accuracy index. Bland-Altman plots were used to test correlation between the CT NCC-LCC and the NCC-LCC aortography with manual calibration and NCC-LCC aortography with automatic calibration.
Inter- and intra-observer analysis using intraclass correlation coefficient (with absolute agreement) and Pearson correlation coefficient for dichotomized data were performed in a sample of 40 cases between the 2 independent cardiologists.
To perform internal validation, previously established cut-off values to determine THV size by aortography were applied in a separate cohort of 40 patients (validation cohort) and compared using the gold standard CCTA-based sizing determination.
Pairs of sizing results based on angiography and CCTA were generated as a study group of interest and classified as concordant or discordant after comparison using the chi square test or Fischer’s exact test, unpaired t test or the Mann-Whitney U test, as appropriate. Statistical analysis was performed using IBM SPSS Statistics software package (version 27, IBM Corporation, United States). All tests were 2-sided at the 0.05 significance level.
After exclusion, 1256/2500 (50.2%) patients who received a BEV were evaluated in the validation cohort (figure 3). Aortography-based diameter measurements were feasible in 393 of these patients (15.7%) (study group of interest).

Figure 3. Study enrollment flow diagram.
Baseline and CCTA characteristics are shown on table 1. The median age of the entire population was 81 (77-85) years, 34.3% female, with a left ventricular function of 60% [47-60], and a median EuroScore II of 3.74 (2.14-6.24).
Table 1. Baseline characteristics
| Balloon-expandable valve (N = 393) | |
|---|---|
| Age, years | 81 [77 - 85] |
| Men | 257 (65.7) |
| BMI, kg/m2 | 26.2 [23.8-29.5] |
| BSA, m2 | 1.92 ± 0.22 |
| NYHA functional class III-IV | 238 (60.9) |
| CCS class III-IV | 32 (8.2) |
| Arterial hypertension | 353 (90.3) |
| Diabetes mellitus | 131 (33.5) |
| Dyslipidemia | 265 (67.8) |
| COPD | 19 (4.9) |
| Smoking history | 123 (31.5) |
| PAD | 77 (19.7) |
| Previous PCI | 162 (41.4) |
| CAD | 341 (87.2) |
| 1 vessel | 204 (52.2) |
| 2 vessels | 57 (14.6) |
| 3 vessels | 80 (20.5) |
| Pacemaker implantation | 36 (9.2) |
| Previous MI | 43 (11) |
| Previous CABG | 37 (9.5) |
| Previous Stroke/TIA | 60 (15.3) |
| Atrial fibrilation | 149 (38.1) |
| Creatinine levels, mg/dL | 1.11 [0.89-1.37] |
| eGRF, mL/min | 60 [46-76] |
| Dialysis | 3 (0.8) |
| Aortic regurgitation grade 2+ | 39 (10) |
| AVA, mm2 | 0.70 [0.60-0.84] |
| LVEF, % | 60 [47-60] |
| Mean Ao gradient, mmHg | 42 [36-49] |
| Peak Ao gradient, mmHg | 68 [59-80] |
| sPAP, mmHg | 42 [33-45] |
| EuroScore I, % | 11.84 [7.82-19.46] |
| EuroScore II, % | 3.74 [2.14 - 6.24] |
| CCTA measurements | |
| Minimum diameter, mm | 21.6 [20.1-23.2] |
| Maximum diameter, mm | 27.9 [26.2-29.6] |
| Mean diameter, mm | 24.8 [23.2-26.3] |
| Area, mm2 | 474 [414-533] |
| Perimeter, mm | 79 [74-84] |
| Visual estimate of the severity of valve calcification | |
| Mild | 80 (20.5) |
| Moderate | 185 (47.3) |
| Severe | 126 (32.2) |
| Visual estimate of the severity of annular calcification | |
| None | 55 (14.1) |
| Mild | 268 (68.5) |
| Moderate | 67 (17.1) |
| Severe | 1 (0.3) |
| Visual estimate of the severity of LVOT calcification | |
| None | 223 (57) |
| Mild | 145 (37.1) |
| Moderate | 23 (5.9) |
|
Data are expressed as no. (%), mean ± standard deviation or mean [interquartile range]. |
|
Procedural characteristics are shown on table 2. Procedural time, fluoroscopic dose, and fluoroscopic time were 48 min [38-59], 919 [444-1712] cGys/cm2, and 10.9 min [8.2-14.7], respectively. Technical success was achieved in 95.4% of the cases. Regarding in-hospital complications (table 3), there rates of major bleeding events, major vascular complication, and in-hospital mortality were 16.1%, 14.6%, and 1.5%, respectively.
Table 2. Procedural characteristics
| Balloon-expandable valve (N = 393) | |
|---|---|
| Elective | 389 (99.5) |
| Need for intubation | |
| Prophylactic | 5 (1.3) |
| Emergency | 8 (2) |
| Use of ECMO | |
| Prophylactic | 0 (0) |
| Emergency | 1 (0.3) |
| Use of cerebral protection device | 16 (4.1) |
| Size of the valve implanted | |
| 23 mm | 118 (30.2) |
| 26 mm | 207 (52.9) |
| 29 mm | 66 (16.9) |
| THV implanted | |
| SAPIEN 3 | 95 (24.3) |
| SAPIEN 3 Ultra | 296 (75.7) |
| Predilatation | 166 (42.5) |
| Postdilatation | 54 (13.8) |
| Contrast media, mL | 139 [110-172] |
| Fluoroscopic time, min | 10.9 [8.2-14.7] |
| Fluoroscopic dose, cGys/cm2 | 919 [444-1712] |
| Procedural time, min | 48 [38 - 59] |
| Technical success | 373 (95.4) |
| Procedural success | 384 (98.2) |
| Intended performance | 380 (97.2) |
| Correct position | 389 (99.5) |
| Multiple valves | 1 (0.3) |
| Access site complications | 18 (4.6) |
| THV embolization | 1 (0.3) |
| Cardiac tamponade | 5 (1.3) |
| Annular rupture | 3 (0.8) |
| Coronary impairment | 0 (0) |
| Procedural CPR | 2 (0.5) |
| Conversion to surgery | 4 (1) |
| Procedural mortality | 3 (0.8) |
| Angiographic AR ≥ moderate | 5 (1.3) |
| Postoperative mean gradient, mmHg | 9 [5-10] |
| Days at the ICU | 1 [1-1] |
|
Data are expressed as no. (%), mean ± standard deviation or mean [interquartile range]. |
|
Table 3. In-hospital complications
| Balloon-expandable valve (N = 393) | |
|---|---|
| Life-threatening bleeding | 11 (2.8) |
| Major bleeding | 63 (16.1) |
| Minor bleeding | 65 (16.6) |
| Major vascular complications | 57 (14.6) |
| Minor vascular complications | 80 (20.5) |
| TIA | 0 (0) |
| Major stroke | 4 (1) |
| Minor stroke | 5 (1.3) |
| Myocardial infarction | 3 (0.8) |
| New pacemaker implantation | 26 (6.6) |
| In-hospital mortality | 6 (1.5) |
|
Data are expressed as no. (%). |
|
No differences were reported regarding the efficacy (94.2% vs 96%; P = .60) and safety profile (90.9% vs 91.9%; P = .84) between discordant and concordant pairs of tomographic and angiographic measurements using aortography with manual calibration, respectively (table 4).
Table 4. Procedural complications in concordant and discordant valve sizes using manual and automatic calibration in aortography vs CCTA (N = 393)
| All (N = 393) | Discordant (N = 121) | Concordant (N = 272) | P | |
|---|---|---|---|---|
| Efficacy | 375 (95.4) | 114 (94.2) | 261 (96.0) | .60a |
| Technical success | 386 (98.2) | 118 (97.5) | 268 (98.5) | .44b |
| Correct position | 391 (99.5) | 120 (99.2) | 271 (99.6) | .52b |
| Intended performance | 382 (97.2) | 117 (96.7) | 265 (97.4) | .74b |
| Safety | 360 (91.6) | 110 (90.9) | 250 (91.9) | .84a |
| Multiple valves | 1 (0.3) | 0 (0) | 1 (0.4) | > .99b |
| THV embolization | 1 (0.3) | 0 (0) | 1 (0.4) | > .99b |
| New pacemaker implantation | 27 (6.9) | 9 (7.4) | 18 (6.6) | .83a |
| AR > moderate after valve implantation | 5 (1.3) | 2 (1.7) | 3 (1.1) | .64b |
| Conversion to surgery | 4 (1.0) | 1 (0.8) | 3 (1.1) | > .99b |
| Procedural mortality | 3 (0.8) | 1 (0.8) | 2 (0.7) | > .99b |
| Life-threatening bleeding | 11 (2.8) | 5 (4.1) | 6 (2.2) | .32b |
| Major bleeding | 64 (16.3) | 20 (16.5) | 44 (16.2) | > .99a |
| Minor bleeding | 66 (16.8) | 16 (13.2) | 50 (18.4) | .24a |
| Major vascular complications | 58 (14.8) | 17 (14) | 41 (15.1) | .87a |
| Minor vascular complications | 81 (20.6) | 22 (18.2) | 59 (21.7) | .50a |
| In-hospital mortality | 6 (1.5) | 2 (1.7) | 4 (1.5) | > .99b |
|
Data are expressed as no. (%). |
||||
A moderate correlation was seen between CCTA-based assessment and aortographic THV size determination: 23 mm, 26 mm, and 29 mm THV sizes were associated with Spearman’s correlation coefficients of 0.528 (P < .01), 0.451 (P < .01), and 0.579 (P < .01), respectively. For more details, see tables 1-3 of the supplementary data.
The suggested angiographic cut-off values for each THV size are shown on table 5. In brief, the best diameter range for selecting 23 mm BEVs was 18.46 mm to 22.55 mm; for 26 mm THVs the best diameter range was 21.55 mm to 24.55 mm while for 29 mm THVs the best diameter range was ≥ 24.25 mm to < 28.50 mm. The intra- and inter-observer intraclass correlation coefficients were 0.931 (95%CI, 0.869-0.963; P < .01), and 0.902 (95%CI, 0.814-0.948; P < .01), respectively (see table 4 of the supplementary data). The CT NCC-LCC distance and NCC-LCC showed an intraclass correlation coefficient of 0.885 (95%CI, 0.834-0.920; P < .01) (figure 4).
Table 5. Suggested angiographic size chart for the Sapien balloon-expandable valve
| 23 mm | 26 mm | 29 mm | |
|---|---|---|---|
| N-L CC distance | 18.46–22.55 | 21.55–24.55 | 24.25–28.50 |
|
mm, millimeter; mm2, square millimeters; N-L CC, non-to-left coronary cusp. |
|||

Figure 4. Bland-Altman plots: A: CCTA vs AOMC; B: CCTA vs AOAC. AOAC, aortography with automatic calibration; AOMC, aortography with manual calibration; CCTA, coronary computed tomography angiography; CI, confidence interval; ICC, intraclass correlation coefficient; SD, standard deviation.
The values obtained were tested and compared with the validation cohort (n = 40) showing moderate-to-good diagnostic test analysis with a good Spearman’s correlation coefficient [0.711 (95%CI, 0.506-0.840; P = < .01)], and moderate diagnostic accuracy (table 5 of the supplementary data). The validation cohort of 40 patients is shown on tables 6 to 10 of the supplementary data.
The 30-day follow-up is shown on table 6. There was no difference in 30-day mortality between discordant and concordant tomographic and angiographic measurements (1.7% vs 2.6%; P = .73). There was no difference at 30 days regarding the mean gradient (11 [10-16] vs 12 [10-15] mmHg; P = .76), and more than moderate aortic regurgitation (3.2% vs 1.1%; P = .34) using aortography with manual calibration between discordant and concordant tomographic and angiographic measurements, respectively.
Table 6. 30-day follow-up comparing concordant vs discordant measurements using balloon-expandable valve
| Total (N = 393) | Discordant (N = 121) | Concordant (N = 272) | P | |
|---|---|---|---|---|
| Mortality | 9 (2.3) | 2 (1.7) | 7 (2.6) | .72a |
| CHF | 24 (6.1) | 8 (6.6) | 16 (5.9) | .82b |
| Stroke | 2 (0.5) | 0 (0) | 2 (0.7) | > .99a |
| Valve dysfunction | 8 (2) | 2 (1.7) | 6 (2.2) | > .99a |
| LVEF, %, (n 278) | 60 [60-60] | 60 [57-60] | 60 [50-60] | < .01c |
| Mean gradient, mmHg (n = 265) | 12 [10-15] | 11 [10-16] | 12 [9.8-15] | .76c |
| AR > moderate, (n = 279) | 5 (1.8) | 3 (3.2) | 2 (1.1) | .33a |
| NYHA ≥ III, (n = 345) | 18 (5.2) | 5 (4.6) | 13 (5.5) | .80a |
|
Data are expressed as no. (%), mean ± standard deviation or mean [interquartile range]. |
||||
This single-center, retrospective, observational study investigated the correlation and diagnostic accuracy between angiographic and tomographic measurements to determine THV size according to 1 single angiographic measurement between the NCC and the LCC in patients treated with BEV.
Regarding this objective, the most salient findings are a) angiographic aortic valve annular size determination based on distance measurements between the NCC and LCC is reproducible; b) diagnostic accuracy between CCTA-based and angiography-based aortic valve annular size determination is of moderate strength (table 5 of the supplementary data); and c) internal validation of previously established diameter ranges for angiography-based aortic valve annular size determination revealed moderate diagnostic accuracy.
We found a moderate overall diagnostic accuracy and correlation between angiographic and CCTA measurements to determine aortic valve annular size for THV selection. The use of angiography only measurements may expand the minimalistic TAVI approach in scenarios where CCTA is not an option or is unavailable.
The gold standard method to size the aortic annulus is direct surgical measurement, which is impossible in the TAVI setting. Hereby, several non-invasive reproducible methods have been used to determine the aortic valve annular size.3,5-7,20 However, the CCTA has been established as the gold standard diagnostic tool to determine aortic valve annular size dimensions4 due to its outstanding reproducibility. Before CCTA was established as the actual gold standard method, angiographic measurements were used demonstrating good correlation with direct perioperative measurements in patients undergoing surgical aortic valve replacement (r = 0.93).13 The comparison of transesophageal echocardiography and CCTA and direct perioperative measurements reported by Wang et al.20 showed a moderate correlation. Our study showed moderate diagnostic accuracy and correlation between angiographic and tomographic measurements to determine THV size. Similar results were previously tested in a small sample size of 50 patients where 60% of the valves were properly sized with fair-to-moderate agreement between angiography- and CCTA-guided selections.12 This provides evidence that angiography measurements could potentially be used in scenarios where CCTA is not available or its application is of increased risk.
Radiation exposure during CCTA assessment
It has been shown that TAVI-related imaging studies can potentially increase radiation exposure by some 15.4 to 79 mSv (millisieverts) with the TAVI procedure alone accounting for an effective dose of 26.9 ± 8 mSv and a dose-area product of 2006.3 ± 1152.2 cGys/cm2 (centiGrays/cm2). This radiation exposure is associated with a 70% and 50% increased risk of lung cancer-related death in women and men, respectively, and a 12% to 21%, and 23% to 33% risk of leukemia in women and men, respectively.10 We should mention that our study population experienced lower procedural radiation exposure (919 [444-1712] cGys/cm2) during TAVI including aortic valve annular sizing that may reduce radiation-associated risk of cancer. Using intraoperative low-dose radiation protocols can achieve equal efficacy in TAVI patients same as standard protocols without compromising safety,21 thus reducing radiation exposure and its associated risk. Additionally, the use of balloon-sizing combined with our proposed angiographic measurements may increase accuracy when determining the necessary THV size. Specifically, when the aortography annular measurement falls near the cut-off value between 2 different THV sizes, balloon-sizing can be used to confirm the use of the larger or smaller device.15 Although the additional use of balloon-sizing could increase radiation exposure due to additional imaging acquisition, the use of low-dose radiation protocol can reduce this risk without impacting the final result.21
Contrast media-associated nephropathy
Besides the benefits of mitigating radiation-associated risks, contrast media-associated nephropathy remains a critical concern in patients undergoing TAVI. Chronic kidney disease is present in around 38% of patients with aortic valve stenosis, 55%, 30%, and 15% of whom show mild, moderate, and severe chronic kidney disease.22 The use of contrast media can exacerbate acute kidney injury after its administration in patients with moderate-to-severe chronic kidney disease (from 2% to 17%)11 with a higher estimated 5-year mortality rate.22
Previous studies have demonstrated the safety and efficacy profile of TAVI compared to surgical aortic valve replacement across all ranges of surgical risk.23-28 Against this background, our data suggest that using aortography is safe to facilitate THV size selection in selected indications. In cases where aortography THV sizing was concordant with CCTA determined THV size, the safety and efficacy outcomes reported compared favorably to studies published in similar risk categories of patients.
This study is limited by its single-center observational nature. A randomized or prospective study may be needed to confirm our results. Furthermore, the use of 1 type of fluoroscopy equipment may limit the applicability of the findings to fluoroscopy equipment from alternative manufacturers. Additionally, due to data storage limitations, angiography was not always available to determine the aortic valve annular size through manual or automatic calibration. Upper and lower values of the suggested size chart were determined based on 75th and 25th interquartile range, respectively, due to the lack of upper or lower outliers that would allow us to determine these values.
Angiographic aortic valve annular measurements are reproducible and show moderate correlations and diagnostic accuracy compared to CCTA measurements when selecting the proper BEV THV size. This technique may be appropriate in situations when CCTA is not available, when high radiation exposure needs to be avoided, for patients in critical condition, and to reduce the risk of contrast-induced nephropathy. This strategy could potentially advance the minimalistic TAVI approach in selected patients.
None whatsoever.
H. A. Alvarez-Covarrubias: conceptualization, methodology, formal analysis, investigation, resources, and original drafting of the manuscript. M. Kasel: conceptualization, original drafting of the manuscript, and editing. J.M. Michel: original drafting of the manuscript, and formal analysis. S. Cassese: visualization, investigation: S. Kufner: supervision, and data curation. C. Duesmann, C. Pellegrini, T. Rheude, and N. P. Mayr: resources, and data curation. H. Schunkert: supervision, drafting and revision of the manuscript, and visualization editing. A. Kastrati: supervision, visualization, drafting and revision of the manuscript, and editing. E. Xhepa: drafting of the manuscript, supervision, and formal analysis. G. Borrayo-Sánchez, and M. Joner: conceptualization, drafting and revision of the manuscript, and project administration.
M. Kasel reports being a proctor and consultant for Edwards Lifesciences, but totally unrelated to this study; J. M. Michel reports a being proctor for Boston Scientific, but totally unrelated to this study; S. Cassese reports having received grants from Abbott Vascular, Boston Scientific, and SIS Medical AG, consulting fees from SIS Medical AG, and speaker fees from Abiomed, Astra Zeneca, SIS Medical AG, and Teleflex, but totally unrelated to this study; S. Kufner reports having received speaker and consultant fees from AstraZeneca, Bristol Myers Squibb, Bentley, and Translumina, but totally unrelated to this study; C. Pellegrini reports having received a grant from Else-Kröner Fresenius Memorial Stipendium, but totally unrelated to this study; T. Rheude reports having received lecturer fees from SIS Medical AG, and Astra Zeneca, but totally unrelated to this study; H. Schunkert reports having received consulting, honoraria, and speaker fees from AMGEN, Daiichi-Sankyo, MSD SHARP&DOHME, Astra Zeneca, Bayer Vital, Boehring-Ingelheim, Novartis, Servier, and Synlab, but totally unrelated to this study; A. Kastrati reports a patent number PCT/EP2021/053116, and participation on the Data Safety Monitoring Board of the DSMB-TARGET Trial, but totally unrelated to this study; E. Xhepa reports having received lecturer and speaker fees from Astra Zeneca, Boston Scientific, and SIS Medical AG, and support for attending meetings from Abbott Vascular, but totally unrelated to this study; G. Borrayo reports being former president of the Asociación Nacional de Cardiólogos de México from 2020 through 2022; M. Joner reports having received grants from Boston Scientific, Cardiac Dimensions, Edwards Lifesciences, Infraredx, consulting fees from Biotronik, TriCares, Veryan and Shockwave, and lecturer and speaker fees from Abbott Vascular, Biotronik, Boston Scientific, Edwards Lifesciences, Cardiac Dimensions, Astra Zeneca, Recor Medical, and Shockwave, but unrelated to this study; the remaining authors declared no conflicts of interest whatsoever. This manuscript is part of the Masters and PhD program in medical sciences of Universidad Nacional Autónoma de México (UNAM).

1. Clavel M-A, Messika-Zeitoun D, Pibarot P, et al. The complex nature of discordant severe calcified aortic valve disease grading: new insights from combined Doppler echocardiographic and computed tomographic study. J Am Col Cardiol. 2013;62:2329-2338.
2. Kasel AM, Cassese S, Bleiziffer S, et al. Standardized Imaging for Aortic Annular Sizing: Implications for Transcatheter Valve Selection. JACC: Cardiovasc Imaging. 2013;6(2):249-62.
3. Francone M, Budde RPJ, Bremerich J, et al. CT and MR imaging prior to transcatheter aortic valve implantation: standardisation of scanning protocols, measurements and reporting-a consensus document by the European Society of Cardiovascular Radiology (ESCR). Eur Radiol. 2020;30:2627-2650.
4. Blanke P, Weir-McCall JR, Achenbach S, et al. Computed Tomography Imaging in the Context of Transcatheter Aortic Valve Implantation (TAVI)/Transcatheter Aortic Valve Replacement (TAVR): An Expert Consensus Document of the Society of Cardiovascular Computed Tomography. JACC: Cardiovasc Imaging. 2019;12:1-24.
5. Fox H, Hemmann K, Lehmann R. Comparison of transthoracic and transesophageal echocardiography for transcatheter aortic valve replacement sizing in high-risk patients. J Echocardiogr. 2020;18:47-56.
6. Vo AT, Nakajima T, Nguyen TTT, et al. Aortic prosthetic size predictor in aortic valve replacement. J Cardiothorac Surg. 2021;16:221.
7. Cerillo AG, Mariani M, Berti S, Glauber M. Sizing the aortic annulus. Ann Cardiothorac Surg. 2012;1:245-256.
8. Okuno T, Heg D, Lanz J, et al. Heart valve sizing and clinical outcomes in patients undergoing transcatheter aortic valve implantation. Catheter Cardiovasc Interv. 2021;98:E768-e79.
9. Medalion B, Blackstone EH, Lytle BW, White J, Arnold JH, Cosgrove DM. Aortic valve replacement: is valve size important? J Thorac Cardiovasc Surg. 2000;119:963-974.
10. Karambatsakidou A, Omar A, Chehrazi B, Rück A, Scherp Nilsson J, Fransson A. Skin dose, effective dose and related risk in transcatheter aortic valve implantation (TAVI) procedures: is the cancer risk acceptable for younger patients? Radiat Prot Dosimetry. 2016;169:225-231.
11. Davenport MS, Perazella MA, Yee J, et al. Use of Intravenous Iodinated Contrast Media in Patients with Kidney Disease: Consensus Statements from the American College of Radiology and the National Kidney Foundation. Radiology. 2020;294:660-668.
12. Gansera L, Ulm B, Bramlage P, et al. Utility of conventional aortic root shot angiography for SAPIEN 3 prosthesis sizing in TAVI: feasibility and inter-reader variability. Open Heart. 2019;6:e001201.
13. Mukharji J, Sloan TJ, Estrera AS, Lipscomb KM. Measurement of aortic root size by biplane angiography before cardiac valve replacement. Am J Cardiol. 1984;53:1084-1086.
14. Kasel AM, Cassese S, Leber AW, von Scheidt W, Kastrati A. Fluoroscopy-guided aortic root imaging for TAVR: “follow the right cusp” rule. JACC Cardiovasc Imaging. 2013;6:274-275.
15. Shivaraju A, Thilo C, Ott I, et al. Tools and Techniques - Clinical: Fluoroscopic balloon sizing of the aortic annulus before transcatheter aortic valve replacement (TAVR) - follow the “right cusp rule”. EuroIntervention. 2015;11:840-842.
16. Shivaraju A, Ott I, Cassese S, et al. Fluoroscopic calcification-guided optimal deployment projection during transcatheter aortic valve replacement - “The eye of the pigtail.” (Follow the right cusp rule- Part II). Catheter Cardiovasc Interv. 2016;87:996-998.
17. Kasel AM, Shivaraju A, Scheidt Wv, Kastrati A, Thilo C. Anatomic Guided Crossing of a Stenotic Aortic Valve Under Fluoroscopy: “Right Cusp Rule, Part III”. JACC: Cardiovasc Interv. 2015 Jan;8(1 Pt A):119-120.
18. Frangieh AH, Ott I, Michel J, et al. Standardized Minimalistic Transfemoral Transcatheter Aortic Valve Replacement (TAVR) Using the SAPIEN 3 Device: Stepwise Description, Feasibility, and Safety from a Large Consecutive Single-Center Single-Operator Cohort. Struct Heart. 2017;1:169-178.
19. Généreux P, Piazza N, Alu MC, et al. Valve Academic Research Consortium 3: updated endpoint definitions for aortic valve clinical research. Eur Heart J. 2021;42:1825-1857.
20. Wang H, Hanna JM, Ganapathi A, et al. Comparison of aortic annulus size by transesophageal echocardiography and computed tomography angiography with direct surgical measurement. Am J Cardiol. 2015;115:1568-1573.
21. Michel JM, Hashorva D, Kretschmer A, et al. Evaluation of a Low-Dose Radiation Protocol During Transcatheter Aortic Valve Implantation. Am J Cardiol. 2021;139:71-78.
22. Bohbot Y, Candellier A, Diouf M, et al. Severe Aortic Stenosis and Chronic Kidney Disease: Outcomes and Impact of Aortic Valve Replacement. J Am Heart Assoc. 2020;9:e017190.
23. Leon MB, Smith CR, Mack M, et al. Transcatheter Aortic-Valve Implantation for Aortic Stenosis in Patients Who Cannot Undergo Surgery. N Engl J Med. 2010;363:1597-1607.
24. Smith CR, Leon MB, Mack MJ, et al. Transcatheter versus Surgical Aortic-Valve Replacement in High-Risk Patients. N Engl J Med. 2011;364:2187-2198.
25. Thyregod HGH, Steinbrüchel DA, Ihlemann N, et al. Transcatheter Versus Surgical Aortic Valve Replacement in Patients With Severe Aortic Valve Stenosis. J Am Coll Cardiol. 2015;65:2184-2194.
26. Reardon MJ, Van Mieghem NM, Popma JJ, et al. Surgical or Transcatheter Aortic-Valve Replacement in Intermediate-Risk Patients. N Engl J Med. 2017;376:1321-1331.
27. Mack MJ, Leon MB, Thourani VH, et al. Transcatheter Aortic-Valve Replacement with a Balloon-Expandable Valve in Low-Risk Patients. N Engl J Med. 2019;380:1695-1705.
28. Popma JJ, Deeb GM, Yakubov SJ, et al. Transcatheter Aortic-Valve Replacement with a Self-Expanding Valve in Low-Risk Patients. N Engl J Med. 2019;380:1706-1715.
* Corresponding author.
E-mail address: gabyborsan@gmail.com (G. Borrayo-Sánchez).
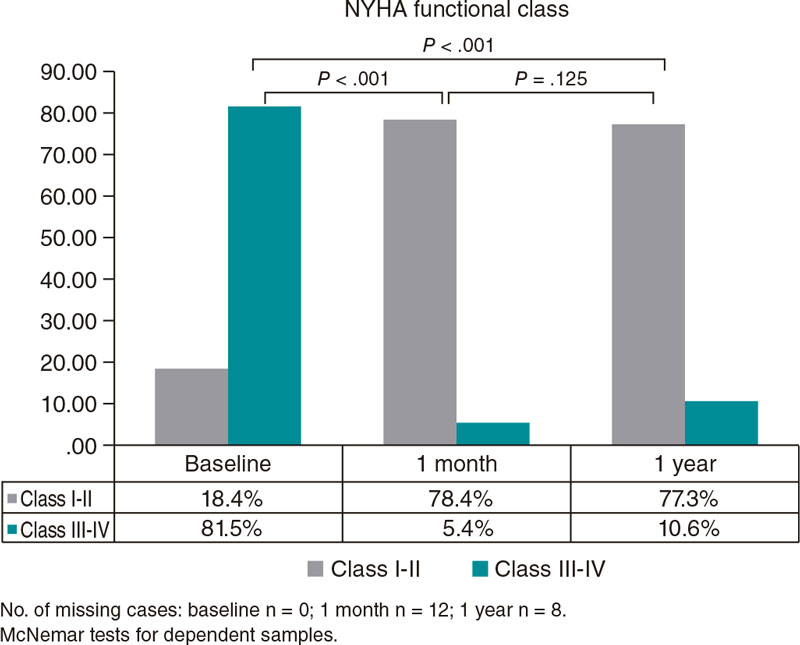
Introduction and objectives: Transcatheter aortic valve implantation (TAVI) is an increasingly used procedure to treat severe aortic stenosis (AS) that should be monitored in the real-world routine clinical practice. We assessed TAVI outcomes (SAPIEN 3) in terms of the patient’s health-related quality of life (HRQoL), clinical endpoints, and resource utilization considering a valid risk score.
Methods: This was an observational prospective study including all consecutive patients with severe AS treated with TAVI (Edwards SAPIEN 3, transfemoral access) conducted during the calendar year of 2018. A systematic assessment of the patients’ HRQoL (EQ-5D-5L, the 36-item Short Form Health Survey, and the Kansas City Cardiomyopathy Questionnaire), clinical endpoints, and resource utilization (length of stay at the hospital/intensive care unit setting) was implemented. Assessment was scheduled before the procedure (baseline), at discharge, and 1, 6, and 12 months after implantation. Multivariate regression models were applied to test outcomes while controlling the patients’ risk (eg, Society of Thoracic Surgeons risk score).
Results: A total of 76 patients (50% female) with a mean age of 82.05 ± 4.76 years, and 55% with intermediate-high risk were included. The rates of successful impantation and cardiac death were 97.37% and 2.63%, respectively, at 1 year. Significant reductions in mean and maximum gradients were achieved and maintained at follow-up. The mean length of stay at the hospital (5.2 6 ± 4.05) and intensive care unit setting (0.22 ± 0.64) was short. Significant improvements (all adjusted P < .05) were detected in the Kansas City Cardiomyopathy Questionnaire overall summary scores, EQ-5D-5L, and the 36-item Short Form (physical component summary).
Conclusions: This research highlights how positive clinical outcomes translated into significant improvements in relation to the patients’ HRQoL. Use of resources —generally low— was based on the Society of Thoracic Surgeons risk score. (SARU Study; code: 2017-01, Murcia, Spain).
Keywords: Aortic valve stenosis. Quality of life. Health resources. Length of stay. Clinical endpoint. Burden of illness.
Introducción y objetivos: El uso del implante percutáneo de válvula aórtica (TAVI, transcatheter aortic valve implantation) está aumentando en el tratamiento de la estenosis aórtica grave. Por ello, el uso de TAVI en la vida real debe monitorizarse. Evaluamos los resultados del TAVI en términos de calidad de vida relacionada con la salud (CVRS), resultados clínicos y uso de recursos teniendo en cuenta un marcador de riesgo válido.
Métodos: Estudio observacional prospectivo incluyendo todos los pacientes consecutivos con estenosis aórtica grave tratados con TAVI (Edwards SAPIEN 3, acceso transfemoral) en 2018. Se evaluaron de forma sistemática la CVRS (EQ-5D-5L, Short Form-36 Health Survey, Kansas City Cardiomyopathy Questionnaire), los resultados clínicos y el uso de recursos (estancia en planta/unidad de cuidados intensivos). La evaluación se hizo antes de la intervención (basal), al alta y después de 1,6 y 12 meses del implante. Se aplicaron modelos de regresión multivariante para evaluar los resultados mientras se controlaba el riesgo del paciente (por ejemplo, escala de riesgo de la Society of Thoracic Surgeons).
Resultados: Se inc luyó a 76 pacientes (el 50% mujeres), con una edad media de 82,05 ± 4,76, y el 55% con riesgo intermedio-alto. Hubo un 97,37% de éxito del implante y la tasa de muerte de causa cardiovascular fue del 2,63% al año. Se consiguieron reducciones significativas en los gradientes medios y máximos, y se mantuvieron durante las visitas de seguimiento. Las estancias medias en planta (5,26 ± 4,05 días) y en la unidad de cuidados intensivos (0,22 ± 0,64 días) fueron bajas. Se detectaron mejoras significativas (todo ajustado p < 0,05) en el Kansas City Cardiomyopathy Questionnaire (puntuaciones generales), el EQ-5D-5L y el Short Form-36 (componente físico).
Conclusiones: Esta investigación destaca resultados clínicos positivos que se traducen en mejoras significativas en términos de calidad de vida de los pacientes. El uso de recursos, que fue en general bajo, también fue dependiente de la escala de riesgo de la Society of Thoracic Surgeons. (Estudio SARU, código: 2017-01, Murcia, España).
Palabras clave: Estenosis valvular aórtica. Calidad de vida. Recursos sanitarios. Estancia. Resultado clínico. Carga de la enfermedad.
Abbreviations
AS: Aortic stenosis. HRQoL: Health-related quality of life. HRU: Healthcare resource utilization. KCCQ: Kansas City Cardiomyopathy Questionnaire. STS: Society of Thoracic Surgeons. TAVI: transcatheter aortic valve implantation.
Aortic stenosis (AS) is the most common cause of valvular heart disease1 with an estimated prevalence of 3%-5% in people ≥ 65 years to 7.4% in people > 85 years.2,3 Severe AS is the leading cause of valvular surgery among adults. AS typically has a variable but long latent period (asymptomatic) followed by a rapid progression stage after symptom onset (eg, dyspnea, angina or syncope), and has a poor prognosis if aortic valve replacement is not performed in a timely manner.4,5
Although open heart surgery has been the gold standard treatment for many years, aortic valve procedures have progressively become less invasive. Transcatheter aortic valve implantation (TAVI) has become the treatment of choice for inoperable patients with symptomatic, severe AS,6 and a valid alternative for high- and intermediate-surgical risk patients with improved clinical results regarding survival and functional capacity.7,8 Similarly, with new evidence from recent clinical trials, the indication for TAVI was extended to low-risk patients.9,10
According to current clinical guidelines,11 the multidisciplinary decision regarding procedures to solve AS requires an individualized and appropriate assessment of the candidates to optimize the benefits achieved in these patients (eg, regarding survival and symptom amelioration). To this end, significant factors impact the patients’ surgical risk (eg, surgeon-specific risk-adjusted composite according to the Society of Thoracic Surgeons [STS] score), the patient’s quality-adjusted life expectancy, baseline characteristics like frailty (eg, ≥ 2 score in the Katz scale), modifiable risk factors, and comorbidities (eg, chronic obstructive pulmonary disease, pulmonary hypertension, liver disease, previous stroke, anemia, and other systemic conditions). In Europe, recent guidelines recommend TAVI for patients > 75 years. Also, that all patients with AS between 70 and 75 years should be referred for TAVI assessment regardless of their surgical risk.12
Due to the wider indication for TAVI and the ageing demographic factor seen in Western countries,3 TAVI is increasingly used in the routine clinical practice across Europe. This underscores the importance of monitoring TAVI outcomes, particularly among elderly patients to better characterize performance in the real-world practice.
Therefore, our objective was to prospectively assess TAVI (SAPIEN 3, Edwards Lifesciences, United States) outcomes regarding the patient’s health-related quality of life (HRQoL), and the clinical outcomes considering their surgical risk. Also, as secondary endpoint, a description of healthcare resource utilization adjusted for surgical risk (STS score) was intended.
This was a prospective, observational study of all consecutive patients with severe, symptomatic AS treated with elective TAVI via transfemoral access with SAPIEN 3 at the regional Hospital Universitario Virgen de la Arrixaca, a tertiary hospital and a regional referral center for cardiothoracic surgery and interventional cardiology located in Murcia, Spain. Patients received TAVI regardless of the study as part of the routine clinical practice. The recruitment stage was during the calendar year of 2018. In this study we present the observed results from the systematic djustent conducted 1 year after TAVI.
According to the ESC/EACTS guidelines,6 implantation decision was made by the heart team and all procedures followed the recommendations established by the manufacturer’s SAPIEN 3 valve instructions for use. All patients were followed for, at least, 12 months after TAVI and systematically assessed according to the hospital clinical protocol. Written patient information was provided to each participant, and the patient’s consent on data collection was signed before being included in the study that was conducted in full compliance with the recommendations guiding biomedical research in human subjects adopted by the 18th World Medical Assembly, Helsinki, Finland back in 1964. The study protocol was approved by the assigned ethics Committee (Murcia, SARU Study; code: 2017-01. Effective date, 02/06/2017).
Clinical assessment was conducted at baseline (preoperative), post-intervention (perioperative), and 30 days, 6 months, and 1 year after the procedure. The main objective clinical variables included echocardiographic measurements (eg, paravalvular and total aortic regurgitation, left ventricular ejection fraction, mean and maximum aortic valve gradient, effective orifice area), and major clinical events automatically available in the medical records (eg, all-cause and cardiovascular mortality, stroke, bleeding complications, myocardial infarction, new-onset atrial fibrillation, major vascular complications, permanent pacemaker implantation, rehospitalization and acute kidney injury). In addition, the patients’ New York Heart Association (NYHA) functional class IV was systematically registered. The patients’ risk profile was characterized based on the STS risk score which was validated for the in-hospital and 30-day mortality rates following surgical aortic valve replacement.13 Additionally, postoperative complications were defined based on a modified version of the Valve Academic Research Consortium criteria,14 and this score was routinely applied based on the clinical protocols of our referral hospital.
Finally, length of stay (LOS)–at the hospital and the intensive care unit (ICU) settings–associated with the TAVI procedure was automatically registered for each patient based on hospital medical records and described as a secondary endpoint in this research.
A comprehensive assessment was implemented by combining a patient-reported disease-specific tool that has a higher ability to capture changes in the patient’s health status during the observation period, and 2 generic tools to establish comparisons with findings from other procedures or diseases and with the Spanish normal population. Patients’ health-related quality of life was evaluated at baseline and during per protocol medical visits for health management (6 months and 1 year after TAVI).
The Kansas City Cardiomyopathy Questionnaire (KCCQ)15 is a 23-item self-administered disease-specific questionnaire originally developed for patients with heart failure to monitor their reported symptoms and evaluate how and to what extent their heart failure impacts their quality of life (QoL) within a 2-week recall period. The KCCQ includes 6 distinct domains (physical function, symptoms, symptom stability, social limitation, self-efficacy, and quality of life) added to 2 summary scores: the clinical summary score (CSS) and the overall summary score (OSS). Summary scores can be transformed into 0–100 scales with higher scores being indicative of better levels of wellbeing to facilitate score interpretation. This tool has been recently revised and qualified for its use in heart failure by the United States Food and Drug Administration16 with minimal clinically important differences defined as 5-point changes in summary scales.17 Also, the KCCQ has a sound psychometrical performance when measuring functional status and HRQoL in patients with severe, symptomatic AS.18
The EQ-5D-519—a patient-reported measure—includes a descriptive system and the EQ visual analogue scale (EQ-5D-5L VAS). The former includes 5 different domains: mobility, self-care, usual activities, pain/discomfort, and anxiety/depression. Responses to the EQ-5D-5L descriptive system were assigned preference-based (utility) weights from the Spanish population. The EQ-5D-5L VAS reflects the patient’s self-rated health on a vertical visual analogue scale (from 0, ‘the worst health you can imagine’ up to 100, ‘the best health you can imagine’).20,21
The Medical Outcomes Study Short Form-36 (SF-36)22 is one of the most widely used and evaluated generic HRQoL questionnaires. It includes 8 dimensions and 2 summary scores (physical component summary [PCS] and mental component summary [MCS]). In this study we used a standardization of summary scores based on age and gender using the Spanish population normative data.23
First, an exploratory analysis was performed to characterise the analytic cohort presented in this manuscript. Descriptive statistics were used for continuous variables (eg, mean, standard error of measurement) and frequency tables or proportions for discrete variables. McNemar’s test for dependent samples was used to compare NYHA health states at follow-up. Regarding the objective of this study, multivariate models (linear general models with repeated measures at different time points —baseline, 6M, and 12M— as intra-subject factors) were computed to better assess the potential benefits of both regarding clinical endpoints and the patients’ HRQoL at follow-up (baseline, 6M, and 12M) while considering the patients’ comorbidities and risk profile at baseline. To this end, the STS predicted risk of mortality score was included because it is a weighted index of the patients’ risk robustly estimated using a Bayesian hierarchical model for both mortality and major complication events. This model considers 24 meaningful preoperative variables like age, sex, body surface area, atrial fibrillation, chronic heart failure, NYHA functional classification, chronic obstructive pulmonary disease, diabetes mellitus, need for insulin use, arterial hypertension, previous cardiac surgeries, concomitant mitral stenosis, unstable angina, previous percutaneous coronary intervention, and other variables. Based on the estimated STS score, patients were classified into 3 risk groups: high (≥ 8%), intermediate (≥ 4%), and low mortality risk (< 4%).13 Importantly, this score was also considered in the secondary endpoint associated with the description of the LOS (at both the hospital and ICU settings) related to TAVI procedures.
Regarding the size of the sample required to conduct the adjusted analyses described above, the estimated minimal sample size was set at 60 TAVI patients to compare within and between subject differences at 3 different time points of evaluation, effect size (f) was 0.25, statistical power (1-β), 0.9, and risk of type-I error (1-α), 0.95 assuming a weak correlation among repeated measures (0.3).
The software statistical package SPSS 27.0 for Windows (IBM Corp., United States) and the R software (The R Project for Statistical Computing, Institute for Statistics and Mathematics, Austria) were used for analysis.
A total of 76 consecutive patients, 50% female, with a mean age of 82.05 ± 4.76 years underwent elective TAVI during the study period comprising the analytical cohort. STS (surgical risk) score was 5.4 ± 3.41 while 42.5%, 43.8%, and 13.7% of the cases were classified as low-, intermediate-, and high-risk patients, respectively. A complete description of comorbidities is shown on Table 1. Previous coronary artery bypass graft was reported in 1 patient. A total of 6 cases (7.9%) were valve-in-valve procedures, and in 71 cases (93.4%) vascular access was via right femoral artery. Only 1 patient required general anaesthesia before TAVI (table 1 of the supplementary data). The patients’ functional status (NYHA classification) at baseline was remarkably impaired in most cases with 61.84%, and 19.74% of the patients having NYHA functional class III and IV, respectively.
Table 1. Preoperative characteristics of TAVI patients (N = 76)
| Previous disease | n | % |
|---|---|---|
| Dyslipidemia | 51 | 67.11 |
| Arterial hypertension | 66 | 86.84 |
| Previous stroke | ||
| With effects | 1 | 1.32 |
| Without effects | 4 | 5.26 |
| TIA | 4 | 5.26 |
| Liver disease | 0 | 0.00 |
| Diabetes mellitus | ||
| Diet | 1 | 1.32 |
| Oral agents | 22 | 28.95 |
| Insulin | 17 | 22.37 |
| No treatment | 1 | 1.32 |
| CKD | 26 | 34.21 |
| Smoker | ||
| Active smoker | 2 | 2.63 |
| Non-smoker | 48 | 63.16 |
| Former smoker | 25 | 32.89 |
| Oncological disease | 8 | 10.53 |
| COPD | 9 | 11.84 |
|
COPD, chronic obstructive pulmonary disease; CKD, chronic kidney disease; DM, diabetes mellitus; TIA, transient ischemic attack. |
||
Successful implantation was achieved in 74 cases (97.37%), and 2 patients (2.63%) died within the first 30 days after the procedure (both cardiovascular causes). In this period, the observed rates of major complications or rehospitalizations were low (Table 2), and permanent pacemaker implantation was required for 5 patients. One year after TAVI, no additional cardiovascular deaths were reported. However, 7 patients died of other causes (Table 2). We should mention that the sample mortality rate was similar to that of a comparable general population (figure 1 of the supplementary data). According to echocardiographic measurements, significant benefits in mean and maximum gradients, and aortic regurgitation were achieved and maintained at follow-up (figure 2 of the supplementary data). Notably, among survivors, 78.4% of patients had a NYHA functional class I-II at 1 month, a benefit that was maintained at 1 year with 77.3% of patients in these functional levels.
Table 2. Clinical outcomes seen at 30 days and 1 year (N = 76)
| Variable | n | % |
|---|---|---|
| Successful implantation | 74 | 97.37 |
| Death (30d) | 2 | 2.63 |
| Cardiovascular death (30d) | 2 | 2.63 |
| AMI (30d) | 0 | 0.00 |
| Stroke (30d) | 3 | 3.95 |
| Major bleeding (30d) | 4 | 5.26 |
| All-cause rehospitalization (30d) | 4 | 5.26 |
| Permanent pacemaker implantation (30d) | 5 | 6.60 |
| CV rehospitalization (30d) | 2 | 2.63 |
| All deaths (1y*) | 9 | 11.84 |
| All cardiovascular deaths (1y) | 2 | 2.63 |
|
* All deaths reported a 1 year: Multiple myeloma: n = 1; sepsis (respiratory tract infection): n = 1; sepsis (renal disease): n = 1; pulmonary disease: n = 1; hepatocellular carcinoma: n = 1; stroke: n = 1; cardiac tamponade: n = 1 (cardiovascular death within 30d); thyroid cancer: n = 1; sudden cardiac death: n = 1 (cardiovascular death within 30d). |
||
The patients’ HRQoL across the observational period according to STS risk score at baseline is shown on figure 1. In both summary scores of the KCCQ (OSS and CSS), statistically and clinically significant improvements after TAVI were seen. In OSS cases, the mean differences reported between baseline and 6 months ranged between 18.94 points (low risk) and 29.97 points (intermediate risk) indicative of a meaningful benefit (all P < .001). Similarly, the mean differences regarding the CSS ranged between 13.03 points and 27.3 points (low and intermediate, respectively). In addition, in both scales the observed benefit was maintained at follow-up with no differences being reported at 6 months and 1 year (P > .8 in both summary scales). Remarkably, these improvements were repeated across the 3 risk groups (figure 2).
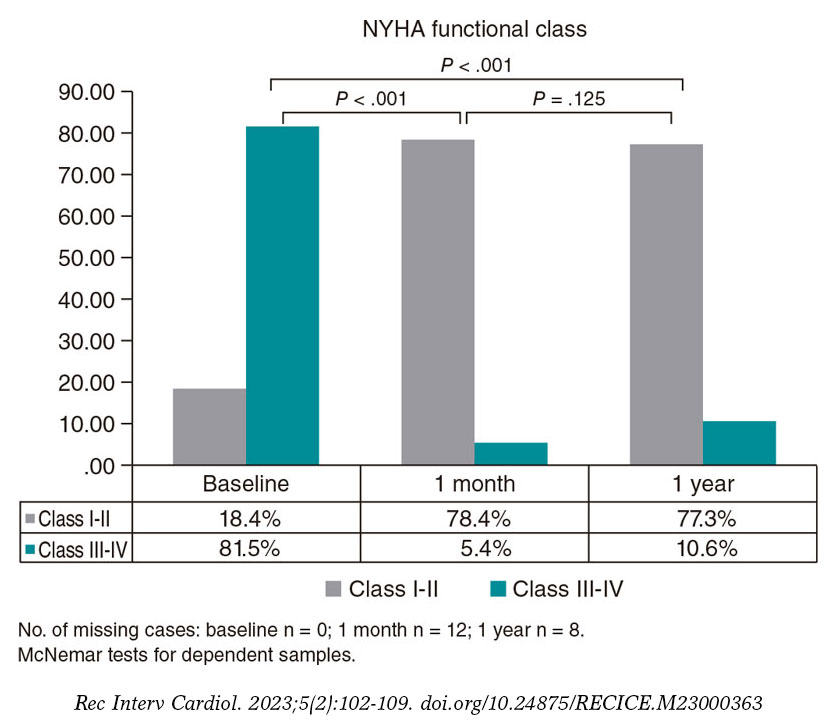
Figure 1. New York Heart Association (NYHA) functional class at follow-up.
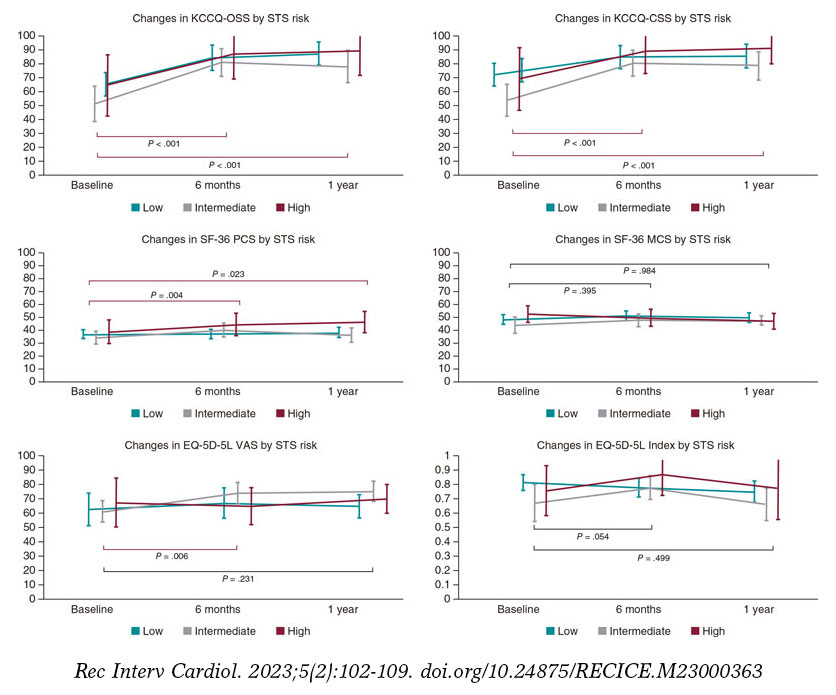
Figure 2. Changes in patient’s health-related quality of life at follow-up (n = 55, out of 67 survivors at 1 year; 82.1% of the sample). No differences in mean/median baseline values were seen in any of the health-related quality of life (HRQoL) measures taken between the patients who completed all the measurements and those with missing values at study period. EQ-5D-5 VAS, EQ visual analogue scale; KCCQ, Kansas City Cardiomyopathy Questionnaire; KCCQ CSS, KCCQ clinical summary score; KCCQ OSS, KCCQ overall summary score; SF-36 MCS, Medical Outcomes Study Short Form-36 Mental Component Summary; SF-36 PCS, SF-36 Physical Component Summary.
Regarding generic questionnaires, a positive impact was also seen in EQ-5D-5L VAS scores and the SF-36 Physical Component Summary, postoperatively, in all patients (P < .006 and P < .004, respectively). However, the size of detected differences was smaller considering the respective scales. No statistically significant differences were seen in the mental component summary (P = .395). In addition, values in all groups were comparable to normative population based on age and sex since baseline (mean—95% confidence interval [95%CI]—at baseline: 47.44, 44.70, and 50.18; 6 months: 49.77, 47.36, and 52.17; and 1 year: 48.64, 46.04, and 50.83-; P = .52). Finally, EQ-5D-5L index values were fairly similar across all time points with a slight increase observed at 6 months (P = .054 compared to baseline) and a mild drop at 1 year, not reaching statistical significance compared to baseline values (mean—95%CI—at baseline: 0.77, 0.71, and 0.83; 6 months: 0.80, 0.75, and 0.85; and1 year: 0.74, 0.68, and 0.80; P = .499).
Mean LOS at the hospital setting was limited with a mean stay of 5.26 days (± 4.05), and only 10 patients (13.2%) required intensive care, 5 of whom (6.6% of the overall sample) remained at the ICU setting ≤ 1 day, 3 (3.9%) for 2 days, and 2 (2.6%) for 3 days. In figure 3, the ICU and hospital stays are shown based on the patients’ baseline risk (very low in all subgroups).
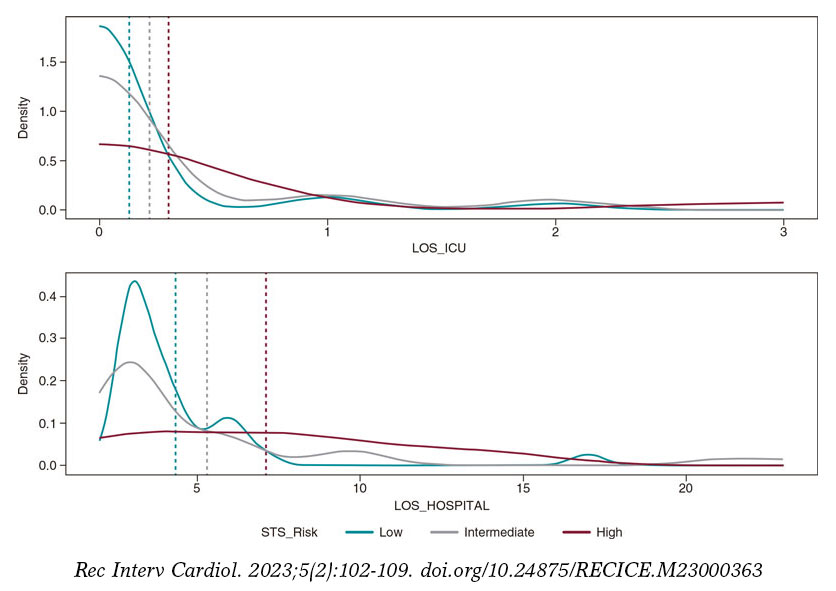
Figure 3. Length of stay (the hospital and the ICU settings) according to STS PROM score; n = 76 for LOS at the hospital setting, and n = 73 for LOS at the ICU setting. ICU, intensive care unit; LOS, length of stay; STS, Society of Thoracic Surgeons.
Ideally, severe, and symptomatic AS should be treated with a valve implanted via minimally invasive procedures while securing minimal perioperative and long-term risks, optimizing hemodynamic response, avoiding patients’ dependency on lifelong anticoagulation therapy, and maximizing their ability to do activities of daily living, and wellbeing. Insights from clinical trials indicate that the management of AS is moving in this direction.7,9 However it is still important to evaluate each innovation in real practice. This study provides new evidence on the performance of TAVI in elderly patients—mean age > 80 years—under real-world practice through a systematic prospective assessment of clinical outcomes, LOS, and patients’ reported outcomes 1 year after the procedure.
In our study, a noticeable positive clinical effect of TAVI was seen in all STS subgroups. Mean and maximum aortic gradients along with valve regurgitation improved significantly after the procedure, and major complications were kept at very reasonable rates. These outcomes were very similar to those recently published on SAPIEN 3.24 Also, regarding the NYHA scale, the percentage of patients with satisfactory functional status increased immediately after the procedure and was maintained at 1 year among survivors.
Importantly, these clinical benefits translated into meaningful improvements in the patients’ HRQoL. Particularly, the OSS of the KCCQ showed a mean change from baseline from 18.9 points in low-risk patients up to near 30 points in intermediate risk 6 months after treatment). Also, this benefit was preserved at 1 year with ranges between 21.9 points in low risk to 26.7 points in intermediate risk. These increments reported in the KCCQ were clearly over the minimal clinically important differences described in the medical literature for this tool.17 Actually, these results are especially important considering than a 10 points drop in KCCQ OSS scores turned out to be a prognostic factor for patients with AS associated with 34% more chances of dying at 12 months.18 Therefore, the HRQoL of older patients who survived 1 year improved significantly. Our results are similar to those from a former research that studied clinical outcomes from TAVI in clinical trials and registries including the SAPIEN 3. For instance, Baron et al.24—according to data from the SAPIEN 3 intermediate-risk registry—found changes at 1 year from TAVI in OS of 23.1 points (21.8-24.9; P > .001) among intermediate-risk patients. Their cohort had similar baseline characteristics and underwent TAVI with the same device (they did, however, include transfemoral and transapical access). In our study, we saw that this enhanced self-perceived health is also maintained in elderly patients classified as low- and high-risk patients.
Regarding generic tools, a positive trend was also detected in the EQ-5D-5L VAS and the PCS of the SF-36 (a summary component more focused on the overall functional performance of patients) with significant differences at 6 months and 1 year. We should mention that no differences were found at follow-up regarding the mental component summary. Also, the patients’ mental health was slightly lower compared to that reported in their reference population since baseline. Similarly, regarding the estimated utilities from the EQ-5D-5L, a global positive trend was seen at 6 months from baseline and a slight drop after 1 year. Nevertheless, all changes detected with this tool were minimal. This finding was surprising considering the great benefit demonstrated with both the OSS and the CSS of the KCCQ. However, as the EQ-5D-5L captures health-related quality of life more globally together with the mean age of the patients included, the slight decline seen could reflect general deterioration of health accumulated over the 1-year observational period (mean age of the sample > 80 years).
Furthermore, consistent with recent experiences in centers of excellence regarding TAVI in Italy, the Netherlands, and the UK, where authors tested novel standardized clinical care pathways to optimize the process with early discharge while reducing complications and LOS,25 we saw a very limited hospital stay with only 13% of patients requiring ICU admission (6.5% of the patients needed 3 days at the ICU). In our center, following an individualized protocol for candidates eligible for TAVI, we saw very high-quality outcomes in elderly patients while minimizing the procedure-related LOS.
Inherently to the nature of this observational study, our findings are subject to a few limitations. First, our findings come from the experience of a single center in a tertiary referral hospital very familiar with the procedure so the extrapolation of these results might be affected by the experience of the heart team. Importantly, sample size, especially in the high-risk group, was limited and subject to high dispersion of values and missing data at follow-up. Therefore, further research with a larger number of patients stratified by risk should confirm our findings. Despite this limitation, we should mention that our results observed in the intermediate-risk group are similar to those reported with larger samples allowing for extensive propensity score cohort adjustment.24
Also, in this analysis, we decided to use the STS score as a measure of patient-risk characterization because, even when we acknowledge that this was originally developed for surgical aortic valve replacement, it is a valid prognostic measure of mortality and occurrence of major complications in TAVI making up a comprehensive assessment of the patients’ health status.13,26 However, as it has been described in recent research,27,28 it would also be helpful to include a measure of frailty to complete thedjusttments. Unfortunately, this information was not routinely collected through a standard form as part of the standard clinical management when this study was conducted. Nevertheless, we should mention that in our center, the heart team involved in the decision-making process regarding the individualized management of the patients’ clinical condition, always considers frailty as a key parameter to better adjust the provision of care. Also, precisely due to this preoperative assessment most patients classified as low risk by the STS score (42.5%) were treated with TAVI instead of open surgery. Hence, frailty is a core aspect of this process, always among other important factors like patient preference, history of chest radiation, previous coronary artery bypass graft or porcelain aorta, and others. Although through the comprehensive analysis of clinical and patient-reported outcomes a consistent and positive tendency in outcomes has been shown, we should mention that our results come from a cohort of patients treated in 2018. Consequently, it would be interesting to conduct a new study in multiple centers to obtain data to compare the evolution of the current clinical practice outcomes to those from 2018. Therefore, further research is warranted to continue this monitorization of outcomes in larger samples of patients.
In conclusion, this research provides clinical and patient-reported evidence on the performance of TAVI in elderly patients with clinical benefits maintained 1 year after the intervention. Furthermore, the short hospital stay observed provides exploratory insights into the benefits of standardized protocols created to manage low- to high-risk patients safely and efficiently.
Edwards Lifesciences provided funds for the analysis of this study that was conducted and interpreted independently by clinicians and methodological experts.
E. Pinar, J. García de Lara, J. Hurtado, B. Martí-Sánchez, G. Leithold, and J. Cuervo were involved in the study idea and design, and in the analysis of the study data. All authors were involved in the interpretation of the results and in the critical revision of the paper regarding its intellectual content and agree on the final version of the manuscript to be published.
J. Cuervo, who works for Axentiva Solutions, disclosed that Axentiva Solutions has received financial support in the form of consultancy payments from Edwards Lifesciences towards the design and analysis of the study, and for medical writing support. B. Martí-Sánchez, and P. González work for Edwards Lifesciences. E. Pinar, J. García de Lara, J. Hurtado, M. Robles, G. Leithold, and K. Rand declared no conflicts of interest whatsoever.
1. Iung B, Delgado V, Rosenhek R, et al. Contemporary Presentation and Management of Valvular Heart Disease: The EURObservational Research Programme Valvular Heart Disease II Survey. Circulation. 2019;140:1156-1169.
2. Ferreira-González I, Pinar-Sopena J, Ribera A, et al. Prevalence of calcific aortic valve disease in the elderly and associated risk factors: A population-based study in a Mediterranean area. Eur J Prev Cardiol. 2013;20:1022-1030.
3. Durko AP, Osnabrugge RL, Van Mieghem NM, et al. Annual number of candidates for transcatheter aortic valve implantation per country: current estimates and future projections. Eur Heart J. 2018;39:2635-2642.
4. Otto CM, Lind BK, Kitzman DW, Gersh BJ, Siscovick DS. Association of Aortic-Valve Sclerosis with Cardiovascular Mortality and Morbidity in the Elderly. N Engl J Med. 1999;341:142-147.
5. Otto CM, Burwash IG, Legget ME, et al. Prospective study of asymptomatic valvular aortic stenosis: Clinical, echocardiographic, and exercise predictors of outcome. Circulation. 1997;95:2262-2270.
6. Baumgartner H, Falk V, Bax JJ, et al. 2017 ESC/EACTS Guidelines for the management of valvular heart disease. Eur Hear J. 2017;38:2739-2791.
7. Thourani VH, Kodali S, Makkar RR, et al. Transcatheter aortic valve replacement versus surgical valve replacement in intermediate-risk patients: a propensity score analysis. Lancet. 2016;387:2218-2225.
8. Herrmann HC, Thourani VH, Kodali SK, et al. One-Year Clinical Outcomes With SAPIEN 3 Transcatheter Aortic Valve Replacement in High-Risk and Inoperable Patients With Severe Aortic Stenosis. Circulation. 2016;134:130-140.
9. Mack MJ, Leon MB, Thourani VH, et al. Transcatheter Aortic-Valve Replacement with a Balloon-Expandable Valve in Low-Risk Patients. N Engl J Med. 2019;380:1695-1705.
10. Popma JJ, Deeb GM, Yakubov SJ, et al. Transcatheter Aortic-Valve Replacement with a Self-Expanding Valve in Low-Risk Patients. N Engl J Med. 2019;380:1706-1715.
11. Otto CM, Nishimura RA, Bonow RO, et al. 2020 ACC/AHA Guideline for the Management of Patients With Valvular Heart Disease: Executive Summary: A Report of the American College of Cardiology/American Heart Association Joint Committee on Clinical Practice. Circulation. 2021;143:e35-e71.
12. Kuck K-H, Bleiziffer S, Eggebrecht H, et al. Konsensuspapier der Deutschen Gesellschaft für Kardiologie (DGK) und der Deutschen Gesellschaft für Thorax-, Herz- und Gefäßchirurgie (DGTHG) zur kathetergestützten Aortenklappenimplantation (TAVI) 2020. Der Kardiol. 2020;14:182-204.
13. Kumar A, Sato K, Narayanswami J, et al. Current Society of Thoracic Surgeons Model Reclassifies Mortality Risk in Patients Undergoing Transcatheter Aortic Valve Replacement. Circ Cardiovasc Interv. 2018;11:e006664.
14. Kappetein AP, Head SJ, Généreux P, et al. Updated standardized endpoint definitions for transcatheter aortic valve implantation: The valve academic research consortium-2 consensus document. J Am Coll Cardiol. 2012;60:1438-1454.
15. Green CP, Porter CB, Bresnahan DR, Spertus JA. Development and evaluation of the Kansas City Cardiomyopathy Questionnaire: a new health status measure for heart failure. J Am Coll Cardiol. 2000;35:1245-1255.
16. US Food and Drug Administration -Center for Devices and Radiological Health. Medical Device Development Tool (MDDT) Qualification Decision Summary For Kansas City Cardiomyopathy Questionnaire (KCCQ). 2021. Available at https://www.fda.gov/medical-devices/science-and-research-medical-devices/medical-device-development-tools-mddt. Accessed 20 Nov 2022.
17. Butler J, Khan MS, Mori C, et al. Minimal clinically important difference in quality of life scores for patients with heart failure and reduced ejection fraction. Eur J Heart Fail. 2020;22:999-1005.
18. Arnold S V, Spertus JA, Lei Y, et al. Use of the Kansas City Cardiomyopathy Questionnaire for monitoring health status in patients with aortic stenosis. Circ Heart Fail. 2013;6:61-67.
19. Herdman M, Gudex C, Lloyd A, et al. Development and preliminary testing of the new five-level version of EQ-5D (EQ-5D-5L). Qual Life Res. 2011;20:1727-1736.
20. Hernandez G, Garin O, Pardo Y, et al. Validity of the EQ-5D-5L and reference norms for the Spanish population. Qual Life Res. 2018;27:2337-2348.
21. Ramos-Goñi JM, Pinto-Prades JL, Oppe M, Cabasés JM, Serrano-Aguilar P, Rivero-Arias O. Valuation and Modeling of EQ-5D-5L Health States Using a Hybrid Approach. Med Care. 2017;55:e51-e58.
22. Ware JE, Sherbourne CD. The MOS 36-item short-form health survey (SF-36). I. Conceptual framework and item selection. Med Care. 1992;30:473-483.
23. Vilagut G, Ferrer M, Rajmil L, et al. The Spanish version of the Short Form 36 Health Survey: a decade of experience and new developments. Gac Sanit. 2005;19:135-150.
24. Baron SJ, Thourani VH, Kodali S, et al. Effect of SAPIEN 3 Transcatheter Valve Implantation on Health Status in Patients With Severe Aortic Stenosis at Intermediate Surgical Risk: Results From the PARTNER S3i Trial. JACC Cardiovasc Interv. 2018;11:1188-1198.
25. Barbanti M, van Mourik MS, Spence MS, et al. Optimising patient discharge management after transfemoral transcatheter aortic valve implantation: the multicentre European FAST-TAVI trial. EuroIntervention. 2019;15:147-154.
26. Hemmann K, Sirotina M, De Rosa S, et al. The STS score is the strongest predictor of long-term survival following transcatheter aortic valve implantation, whereas access route (transapical versus transfemoral) has no predictive value beyond the periprocedural phase. Interact Cardiovasc Thorac Surg. 2013;17:359-364.
27. Green P, Arnold S V, Cohen DJ, et al. Relation of frailty to outcomes after transcatheter aortic valve replacement (from the PARTNER trial). Am J Cardiol. 2015;116:264-269.
28. Goudzwaard JA, de Ronde-Tillmans MJAG, El Faquir N, et al. The Erasmus Frailty Score is associated with delirium and 1-year mortality after Transcatheter Aortic Valve Implantation in older patients. The TAVI Care & Cure program. Int J Cardiol. 2019;276:48-52.
* Corresponding author.
Email address: epbhva@yahoo.es (E. Pinar Bermúdez).
Introduction and objectives: Advances made in transcatheter aortic valve implantation (TAVI) valvular technology have resulted in better outcomes and fewer complications compared with older generations. We studied the rate and determinants of paravalvular leak (PVL) using Evolut PRO vs SAPIEN 3 valves as well as other perioperative and in-hospital outcomes.
Methods: A total of 110 consecutive patients with severe aortic stenosis scheduled for transfemoral TAVI were randomly selected to receive the SAPIEN 3 (N = 59) or the Evolut PRO valve (N = 51). Annular dimensions were determined++ by transesophageal echocardiography guided balloon sizing. The following postoperative and in-hospital endpoints were assessed: PVL, conduction defects, valve embolization, need for a second valve, annular rupture, stroke, vascular complications, acute kidney injury, and in-hospital mortality. We also studied the possible anatomical determinants of PVL.
Results: There were no relevant baseline differences between the 2 groups regarding clinical and echocardiographic characteristics. In-hospital complications were comparable between both valves apart from a significantly higher rate of immediate postoperative PVL and at discharge (≥ grade II) between the Evolut PRO and the SAPIEN 3 valves (19.6% vs 6.8%) and (5.9% vs 1.7%), respectively. Of the anatomical variables described, the left ventricular outflow tract/ascending aorta angle, aortic angulation, and calcification had a significant impact on PVL in the Evolut PRO valves. The left ventricular outflow tract/ascending aorta angle revealed a negative correlation with implantation depth in the Evolut PRO valves but not in the SAPIEN 3 ones.
Conclusions: Both valves demonstrated favorable comparable outcomes except for a significantly higher rate of PVL in patients implanted with Evolut PRO valves.
Keywords: Aortic stenosis. Transcatheter aortic valve implantation. TAVI. SAPIEN 3. Evolut PRO.
Introducción y objetivos: Los avances en la tecnología de implante percutáneo de válvula aórtica (TAVI) han dado lugar a mejores resultados y menos complicaciones en comparación con las generaciones anteriores. Se estudió la incidencia y los determinantes de las fugas paravalvulares (FPV) con las válvulas Evolut PRO y SAPIEN 3, así como otros resultados periprocedimiento y hospitalarios.
Métodos: Se seleccionó aleatoriamente a 110 pacientes consecutivos con estenosis aórtica grave programados para TAVI transfemoral para recibir una válvula SAPIEN 3 (n = 59) o una Evolut PRO (n = 51). Las dimensiones anulares se determinaron mediante el dimensionamiento del balón guiado por ecocardiografía transesofágica. Tras el procedimiento y durante la hospitalización, se evaluaron los siguientes objetivos: FPV, defectos de conducción, embolización de la válvula, necesidad de una segunda válvula, rotura anular, accidente vascular cerebral, complicaciones vasculares, daño renal agudo y mortalidad intrahospitalaria. También se estudiaron los posibles determinantes anatómicos de la FPV.
Resultados: No hubo diferencias basales relevantes entre los 2 grupos en cuanto a las características clínicas y ecocardiográficas. Las complicaciones intrahospitalarias fueron comparables entre ambos tipos de válvulas, excepto una incidencia significativamente mayor de FPV (de grado II o superior) inmediata tras el procedimiento y al alta con las válvulas Evolut PRO en comparación con las SAPIEN 3 (19,6 frente a 6,8% y 5,9 frente a 1,7%, respectivamente). De las variables anatómicas, el ángulo entre el tracto de salida del ventrículo izquierdo y la aorta ascendente, la angulación aórtica y la calcificación tuvieron un impacto significativo en la FPV en las válvulas Evolut PRO. El ángulo entre el tracto de salida del ventrículo izquierdo y la aorta ascendente tuvo una correlación negativa con la profundidad de implantación en las válvulas Evolut PRO, pero no en las válvulas SAPIEN 3.
Conclusiones: Ambas válvulas demostraron resultados favorables comparables, excepto por una incidencia significativamente mayor de FPV en los pacientes con válvulas Evolut PRO.
Palabras clave: Estenosis aórtica. Implante percutáneo de válvula aórtica. TAVI. SAPIEN 3. Evolut PRO.
Abbreviations
AS: aortic stenosis. PVL: paravalvular leak. TAVI: transcatheter aortic valve implantation. VARC: Valve Academic Research Consortium.Over the past decade, the self-expandable CoreValve (Medtronic Ltd, United States) and the balloon-expandable SAPIEN valve (Edwards Lifesciences Ltd, United States) were the valves most commonly used for transcatheter aortic valve implantation (TAVI).1
There are few studies comparing Evolut PRO (Medtronic Ldt, United States) vs SAPIEN 3 (Edwards Lifesciences Ltd, United States), like the SMART trial for small aortic annuli2 and the ALSTER-TAVI all-comers registry.3 However, comparative randomized clinical trials are lacking. Therefore, we designed the present randomized study to provide a head-to-head comparison between these 2 valves regarding procedural data and in-hospital outcomes especially paravalvular leak (PVL). Although the transcatheter heart valves used in this trial are not the latest generation valves of the CoreValve and SAPIEN families (currently, the Evolut-Pro plus and the SAPIEN Ultra), this is the first randomized clinical trial to compare a self-expanding valve with an outer skirt to a balloon expandable valve (with an outer skirt too).
A total of 110 consecutive patients with severe symptomatic aortic stenosis eligible for TAVI were randomly assigned to receive the Evolut PRO valve (51 patients) or the SAPIEN 3 valve (59 patients) at Duisburg Heart Center, Duisburg, Germany, from December 2019 through May 2020. All patients undergoing TAVI for severe aortic stenosis with the SAPIEN 3 and the Evolut PRO via femoral access were included. Patients who underwent TAVI with other valve types like transapically implanted aortic valves, bicuspid aortic valves, and valve-in-surgical-bioprosthesis implantation were excluded. All procedures were performed after obtaining the patients’ written informed consent and in compliance with the national research committee ethical standards.
TAVIs were performed under local anesthesia and conscious sedation. Femoral cutdown was used in all the patients. Annular dimensions were obtained by transesophageal echocardiography-guided balloon sizing during the procedure. With this technique we were able to measure annuli with transesophageal echocardiography and then choose a balloon equal to annular size. Balloon inflation during rapid pacing and aortic angiography were performed with 3 different possibilities in mind a) the balloon completely fills the annulus with no para-balloon leak or waisting indicative that annular size equals the balloon size; b) para-balloon leak is indicative that the annulus is 1 mm to 2 mm larger than balloon size; c) balloon waisting is indicative that the annulus is 1 mm to 2 mm smaller than balloon size.4 Valve type (SAPIEN 3 or Evolut PRO) was randomly selected (using simple randomization method; Monday cases for Evolut and Thursday cases for SAPIEN). Valve size was based on the annular dimensions as suggested by the manufacturers. Based on annular diameter and the diameter of the valve finally selected, a so-called cover index was calculated.5
Our primary endpoints were PVL, in-hospital mortality, and the rate of permanent pacemaker implantation (PPI). The study secondary endpoints were valve embolization, need for a second valve, aortic rupture or dissection, stroke or transient ischemic attack, major vascular complications, and acute kidney injury. Endpoints were defined according to the Valve Academic Research Consortium-2 (VARC-2) definitions.6
Immediate PVL was semi-quantitatively assessed using Seller’s criteria 7: 0/4 (absent); 1/4 (mild); 2/4 (moderate); 3/4 (moderate-to-severe); and 4/4 (severe).7 Transvalvular pressure gradients were obtained invasively using the pullback method. Aortic regurgitation index (AR index) was calculated.8
In case of significant PVL ≥ grade II, if needed, balloon postdilatation using the VACS III or NUCLEUS balloon (NuMED, United States) or else implantation of second valve was used. TTE was performed at discharge to quantify PVL according to the main VARC-2 criteria.9
The following measurements were supported by Philips software (Philips Medical, The Netherlands): the left ventricular outflow tract/ascending aorta (LVOT/AAo) angle was defined as the angle between the axis of the first 4 cm of the ascending aorta (contact surface with the upper part of the prosthesis), and the LVOT axis (the valve landing zone) indicated by a line perpendicular to the plane of the aortic valve annulus).10
Aortic angulation (AA) angle was defined as the angle between the horizontal plane and the plane of aortic annulus.11 We categorized it into < 48° and ≥ 48°.12
Both angles were measured in the optimal fluoroscopic deployment position with all 3 coronary cusps in the same plane (figure 1). Valve implantation depth was assessed in the deployment position on the fluoroscopy from the native aortic annular margin on the side of both the non-coronary cusp (NCC) and left coronary cusp to the proximal edge of the deployed valve on the corresponding side13 (figure 2). Aortic root calcification was fluoroscopically assessed as inexistent, mild (small, isolated calcification spots), moderate (multiple large calcification spots) or severe (extensive calcification).13 Presence or absence of LVOT and mitral annular calcification were also noted.
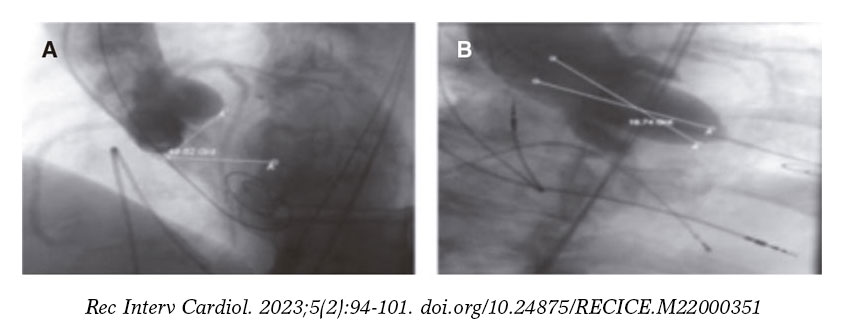
Figure 1. Measurement of different angles. AA, aortic angulation (49.62º). B: LVOT/AAo angle (18.74º). AAo, ascending aorta; LVOT, left ventricular outflow tract.
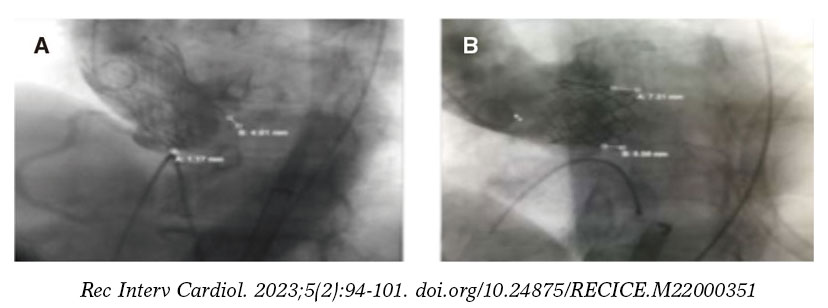
Figure 2. Measurement of implantation depth in the Evolut PRO value. A: [A = 1.17 mm associated with the NCC, and B = 4.91 mm associated with the LCC], and SAPIEN 3. B: [A = 5.65 mm associated with the NCC, and B = 7.31 mm associated with the LCC]. Note high implantation associated with the NCC due to increased LVOT/AAo angle in the Evolut PRO (A) but not in the SAPIEN 3 valve (B). AAo, ascending aorta; LCC, left coronary cusp; LVOT, left ventricular outflow tract; NCC, non-coronary cusp.
Data was collected and analyzed using the SPSS (Statistical Software Package for the Social Sciences, version 20, IBM, and Armonk, United States). Continuous data was expressed as mean ± SD or median (range). Nominal data was expressed as frequency (percentage). For the comparison of nominal and continuous data, the chi-square test and the Student’s t test were used, respectively. Pearson correlation was used to assess the correlation between implantation depth with LVOT and AA angles based on the type of valve. The level of confidence was kept at 95% and hence, P values < .05 were considered statistically significant. Univariable logistic regression analysis was performed for predictors of significant PVL. ROC analysis was performed for the optimum cut-off value of the LVOT/AAo angle for the outcome of significant PVL.
Regarding sample size, assuming a 1:1 ratio in treatment assignments and an estimated rate of a composite primary endpoint (PVL, in-hospital mortality and rate of pacemaker implantation) of 8% in each study group, we estimated that a total of 52 patients were required in each group for the study to reach an 80% statistical power % at a 1-sided alpha level of 0.05
A total of 110 consecutive patients with severe symptomatic aortic stenosis eligible for TAVI were randomly assigned to receive the Evolut PRO (51 patients) or the SAPIEN 3 valve (59 patients). There was no crossover between both study arms. Baseline clinical characteristics were comparable between both types of valves apart from a significantly higher body mass index among SAPIEN 3 patients and a significantly high baseline right bundle branch block in the SAPIEN group (table 1).
Table 1. Patient characteristics associated with the type of valve implanted
| Type of valve | P | ||
|---|---|---|---|
| Evolut PRO (N = 51) | SAPIEN 3 (N = 59) | ||
| Age (years) | 82.6 ± 6.4 | 81.2 ± 5.8 | .22 |
| Sex | .39 | ||
| Male | 54.9 | 59.3 | |
| Female | 45.1 | 40.7 | |
| Body mass index (kg/m2) | 26.4± 4.7 | 28.7 ± 4.7 | .01a |
| Body surface area (m2) | 1.9 ± 0.4 | 1.9 ± 0.2 | .08 |
| Peripheral artery disease | 11.8 | 6.8 | .28 |
| Hypertension | 76.5 | 83.1 | .26 |
| Diabetes mellitus | 29.4 | 37.3 | .25 |
| Ischemic heart disease | 62.0 | 45.8 | .06 |
| Previous revascularization (PCI/CABG) | 41.2 | 37.3 | .53 |
| Previous history of stroke | 5.9 | 5.1 | .58 |
| Previous pacemaker | 9.8 | 6.8 | .40 |
| Chronic chest disease | 9.8 | 23.7 | .31 |
| NYHA class | .09 | ||
| II | 13.7 | 15.3 | |
| III | 86.3 | 78.0 | |
| IV | 0.0 | 6.8 | |
| STS score | 3.8 ± 2.6 | 3.5 ± 2.2 | .51 |
| STS class (%) | .65 | ||
| Low (< 4%) | 58.8 | 66.1 | |
| Intermediate (4% to 8%) | 35.3 | 27.1 | |
| High (> 8%) | 5.9 | 6.8 | |
| ECG findings | .95 | ||
| Sinus | 43.1 | 45.8 | |
| Paced | 7.8 | 6.8 | |
| Atrial fibrillation | 49.0 | 47.5 | |
| Total preoperative conduction defects | 19.6 | 22.0 | .47 |
| Baseline RBBB | 0.0 | 16.9 | .001b |
|
Unless otherwise indicated, data are expressed as no. (%). Preoperative conduction defects included atrioventricular block, intraventricular conduction delay, left anterior hemiblock, left bundle branch block, and RBBB. CABG, coronary artery bypass graft; COPD, chronic obstructive pulmonary disease; OSAS, obstructive sleep apnea syndrome; PCI, percutaneous coronary intervention; RBBB, right bundle branch block; STS, Society of Thoracic Surgery risk score. |
|||
The baseline echocardiographic and fluoroscopic findings of both groups were comparable (table 2).
Table 2. Echocardiographic and fluoroscopic data among the different study groups
| Type of valve | P | ||
|---|---|---|---|
| Evolut PRO (N = 51) | SAPIEN 3 (N = 59) | ||
| Mean PG (mmHg) | 42.3 ± 7.7 | 42.8 ± 9.9 | .78 |
| Maximum PG (mmHg) | 68.5 ± 10.5 | 67.3 ± 12.0 | .56 |
| Aortic valve area (mm) | 0.9 ± 0.7 | 0.9 ± 0.2 | .46 |
| Ejection fraction (%) | |||
| Class of ejection fraction | 48.4 ± 11.7 | 50.9 ± 11.7 | .25 .76 |
| Preserved (> 50%) | 62.7 | 67.8 | |
| Mildly impaired (40% to 50%) | 17.6 | 15.3 | |
| Moderately impaired (30% to 40%) | 9.8 | 11.9 | |
| Severely impaired (< 30%) | 9.8 | 5.1 | |
| Flow gradient (%) | |||
| HFHG | 74.5 | 71.2 | .91 |
| LFLG/Impaired EF | 19.6 | 22.0 | |
| LFLG/Preserved EF | 5.9 | 6.8 | |
| Aortic measurements (by TEE) | |||
| Aortic valve area (mm) | 0.7 ± 0.1 | 0.7 ± 0.2 | .22 |
| Annulus (mm) | 23.8 ± 2.1 | 24.5 ± 1.9 | .07 |
| LVOT (mm) | 21.1 ± 2.1 | 21.6 ± 2.4 | .26 |
| Sinus of Valsalva (mm) | 30.7 ± 3.6 | 31.2 ± 3.8 | .45 |
| Sinotubular junction (mm) | 25.9 ± 3.1 | 26.4 ± 3.5 | .37 |
| Ascending aorta (mm) | 33.3 ± 5.9 | 33.7 ± 4.6 | .68 |
| Distance of STJ/LVOT (mm) | 20.1 ± 10.5 | 19.4 ±3.2 | .62 |
| Aortic root calcification (%) | |||
| Annular calcification | .49 | ||
| Mild | 66.7 | 71.2 | |
| Moderate | 27.5 | 27.1 | |
| Severe | 5.9 | 1.7 | |
| Sinotubular calcification | 5.9 | 8.5 | .44 |
| LVOT calcification | 19.6 | 11.9 | .19 |
| Mitral annular calcification | 15.7 | 18.6 | .44 |
| LVOT/AAo angle (°) | 13.7 ± 5.1 | 13.9 ± 5.2 | .84 |
| AAo angle (°) | 46.5 ± 9.4 | 47.5 ± 12.1 | .62 |
|
AAo, ascending aorta; Ao, aorta; EF, ejection fraction; HFHG, high flow-high gradient; LFLG, low flow-low gradient; LVOT, left ventricular outflow tract; PG, pressure gradient; STJ, sinotubular junction; TEE, transesophageal echocardiography. |
|||
There were few differences in procedural data related to valve design and sheath size as shown on table 3.
Table 3. Procedural data associated with each type of valve
| Type of valve | P | ||
|---|---|---|---|
| Evolut PRO (N = 51) | SAPIEN 3 (N = 59) | ||
| Route (%) | .51 | ||
| Right femoral | 60.8 | 59.3 | |
| Left femoral | 39.2 | 40.7 | |
| Annulus by TEE (mm) | 23.8 ± 2.1 | 24.5 ± 1.9 | .07 |
| Balloon size (mm) | 22.5 ± 1.9 | 22.6 ± 1.9 | .63 |
| Balloon sizing (mm) | 23.4 ± 1.7 | 23.6 ± 1.9 | .44 |
| Valve size (%) | |||
| 23 | 0.0 | 30.5 | |
| 26 | 43.1 | 45.8 | |
| 29 | 56.9 | 23.7 | |
| Sheath size (Fr) | 16.0 | 14.5 ± 0.9 | < .001 |
| Sheath outer diameter (mm) | 7.3 ± 0.1 | 6.2 ± 0.3 | < .001 |
| Femoral artery diameter (mm) | 7.9 ±1.1 | 8.2 ± 0.9 | .20 |
| Sheath femoral artery ratio | 0.9 ± 0.1 | 0.8 ± 0.1 | < .001 |
| Cover index (%) | |||
| TEE | 16.4 ± 5.6 | 5.2 ± 4.2 | < .001 |
| Balloon | 18.3± 3.3 | 8.9 ± 3.3 | < .001 |
| Valve mean pressure gradient | 9.8 | 12.2 | .01 |
| AR index (%) | 28.4 ± 7.8 | 30.7 ± 7.4 | .11 |
| Implantation depth (mm) | |||
| LCC | 5.8 ± 2.3 | 4.2 ± 1.7 | < .001 |
| NCC | 6.3 ± 2.5 | 5.27 ± 1.7 | .01 |
| Amount of contrast (mL) | 145.5 ± 48.8 | 128.6 ± 33.2 | .03 |
| Radiation (mGy) | 4944.4 ± 2294.8 | 4557.8 ± 3133.9 | .46 |
|
AR, aortic regurgitation; LCC, left coronary cusp; NCC, non-coronary cusp; TEE, transesophageal echocardiography. |
|||
There was a significant difference in PVL (both immediate and at hospital discharge) and consequently more balloon postdilatation in the Evolute compared to the SAPIEN 3 group. The use of significantly larger amounts of contrast with the Evolut PRO valves may explain the increased number of acute kidney injury described in this group compared to the SAPIEN valve group. Results were favorable to the SAPIEN 3 valve regarding the endpoints of stroke or in-hospital mortality. However, no statistically significant differences were reported. The rates of device success (absence of a significant PVL (≥ grade II) at hospital discharge, need for second valve implantation, valve embolization, the performance of the prosthetic heart valve, and mortality) were 86% and 98% with the Evolut PRO and SAPIEN 3 valves, respectively; P = .01 (table 4).
Table 4. In-hospital outcomes in patients treated with the Evolut PRO vs the SAPIEN 3 valve
| Type of valve | P value | ||
|---|---|---|---|
| Evolut PRO (N = 51) | SAPIEN 3 (N = 59) | ||
| Immediate PVL | .01 | ||
| No/trace | 19 (37.3) | 46 (78) | |
| Grade I | 22 (43.1) | 9 (15.2) | |
| ≥ grade II | 10 (19.6) | 4 (6.8) | |
| Balloon postdilatation | 8 (15.7) | 3 (5.1) | .35 |
| PVL at discharge | .01 | ||
| No/trace | 26 (50.9) | 49 (83.1) | |
| Grade I | 22 (43.1) | 9 (15.3) | |
| Grade II | 2 (3.9) | 1 (1.7) | |
| Grade III | 1 (2) | 0 | |
| Grade IV | 0 | 0 | |
| Overall new-onset conduction defects | 9 (17.6) | 10 (16.9) | .56 |
| New-onset LBBB | 4 (7.8) | 4 (6.7) | .40 |
| Postoperative pacemaker implantation | 4 (7.8) | 3 (5.1) | .25 |
| Vascular complications | .66 | ||
| Major vascular complications | 2 (3.9) | 2 (3.4) | |
| Minor vascular complications | 4 (7.9) | 3 (5.1) | |
| Bleeding complications | 0 | 0 | |
| Acute kidney injury* | 3 (5.9) | 2 (3.4) | .28 |
| Stroke | 1 (2) | 0 | .46 |
| Valve embolization | 1 (2) | 0 | .46 |
| Need for second valve | 2 (3.9) | 0 | .30 |
| In-hospital mortality rate | 2 (3.9) | 0 | .30 |
|
Data are expressed as no. (%). PVL, paravalvular leak. |
|||
Calcification and the LVOT/AAo angle had a greater impact on PVL in the Evolut PRO compared to the SAPIEN 3 valve. The LVOT/AAo angle was categorized based on the receiver operating characteristic (ROC)-derived cut-off value for the endpoint of significant PVL ≥ grade II: cut-off value = 11º, 80% sensitivity, and 35.8% specificity, area under the curve (0.57; 95% confidence interval, 0.474-0.666; P = .37.) On the other hand, the AA angle did not seem to be very relevant to PVL within the groups (table 5).
Table 5. Association between anatomical factors and PVL in patients treated with the Evolut PRO vs the SAPIEN 3 valves
| Evolut PRO valve (N = 51) | SAPIEN 3 Valve (N = 59) | Pa | Pb | Pc | |||
|---|---|---|---|---|---|---|---|
| < Mild PVL | ≥ Mild PVL | < Mild PVL | ≥ Mild PVL | ||||
| Number | 37.3 | 62.7 | 77.9 | 22.0 | .01 | ||
| Annular calcification | .03 | .2 | |||||
| Mild | 31.4 | 35.3 | 59.3 | 11.9 | .001 | ||
| Moderate | 5.9 | 21.6 | 16.9 | 10.2 | .024 | ||
| Severe | 0.0 | 5.9 | 1.7 | 0.0 | .046 | ||
| LVOT calcification | 1.7 | 17.6 | 3.4 | 8.5 | .04 | .001 | .323 |
| Mitral annular calcification | 0.0 | 15.7 | 15.3 | 3.4 | .001 | .2 | .035 |
| LVOT/AAo anglea | .01 | .001 | |||||
| < 11° | 17.6 | 15.7 | 25.4 | 1.7 | .002 | ||
| ≥ 11° | 19.6 | 47.1 | 52.5 | 20.3 | .03 | ||
| AAo angle (%) | .78 | .34 | |||||
| < 48º | 23.5 | 37.2 | 45.8 | 15.2 | .003 | ||
| > 48º | 13.7 | 25.5 | 32.2 | 6.8 | .001 | ||
|
LVOT, left ventricular outflow tract; AAo, ascending aorta. |
|||||||
Table 6 shows the univariate analysis of predictors of ≥ grade II PVL immediately after the procedure. As demonstrated, moderate and severe valvular calcification, LVOT calcification, and the LVOT/AAo angle contribute to PVL significantly.
Table 6. Univariate analysis of predictors of significant immediate postoperative PVL (grade ≥ 2)
| Variable | Univariate | |
|---|---|---|
| OR (95%CI) | P | |
| Severe calcification | 35.000 (3.138-390.431) | .004 |
| LVOT calcification | 10.921 (3.208-37.174) | < .001 |
| LVOT/AAo angle | 1.047 (0.940-1.165) | .003 |
| AA | 1.016 (0.967-1.067) | .524 |
| Valve type (Evolut PRO) | 2.750 (0.872-8.669) | .084 |
| TEE cover index | 1.099 (1.018-1.188) | .016 |
| Cover index by balloon sizing | 1.108 (1.001-1.226) | .049 |
| LCC implantation depth | 1.199 (0.953-1.510) | .122 |
| RCC implantation depth | 1.167 (0.914-1.489) | .215 |
|
P value was significant if < .05. 95%IC, 95% confidence interval; AA, aortic angulation; AAo, ascending aorta; AR, aortic regurgitation; LCC, left coronary cusp; LVOT, left ventricular outflow tract; PVL, paravalvular leak; RCC, right coronary cusp; TEE, transesophageal echocardiography. |
||
There was a significant negative correlation between the implantation depth of the Evolut PRO valve at the NCC and LVOT/AAo angles (r = -0.38; P = .01). There was no such correlation with the SAPIEN 3 valve (table 7).
Table 7. Correlation of implantation depth (in both valves) with the LVOT/AAo and AA angles
| Type of valve | ||||
|---|---|---|---|---|
| Evolut PRO | SAPIEN 3 | |||
| LCC | NCC | LCC | NCC | |
| LVOT/AAo angle (°) | -0.23 (0.09) | -0.38 (0.01) | 0.09 (0.46) | 0.16 (0.21) |
| AAo angle (°) | 0.13 (0.33) | 0.06 (0.65) | 0.02 (0.87) | 0.06 (0.61) |
|
r indicates strength of correlation and P value indicates significance of correlation. P value was significant if < .05. AAo, ascending aorta; LCC, left coronary cusp; LVOT, left ventricular outflow tract; NCC, non-coronary cusp. |
||||
In this study 2 important findings were made. First, implantation of the Evolut PRO valve was associated with a higher risk of significant PVL compared to the SAPIEN 3 valve. Secondly, the rate of PPI was equal in both groups. Otherwise, both types of valves yielded similar outcomes.
Reducing PVL is an important challenge regarding TAVI as it is associated with worse outcomes especially with the current use of these devices in lower-risk patients.14
A randomized comparison between the CoreValve and SAPIEN XT valves in the CHOICE trial revealed a lower rate of moderate-to-severe PVL in the SAPIEN XT group.15 In the SOLVE-TAVI trial, the non-inferiority of 2 devices (SAPIEN 3 and Evolut R) was reported in terms of their primary efficacy composite endpoint (death, stroke, paravalvular regurgitation, and new pacemaker implantation).16 Currently, the SAPIEN 3 Ultra and Evolut PRO+ have been developed with early favorable outcomes.17
In our study, relevant PVL (≥ grade II) was more common in patients who received the Evolut PRO compared to the SAPIEN 3 valve (9.6% vs 6.8%, respectively). Enríquez-Rodríguez et al. reported a lower rate (2.5%) of moderate to severe PVL with the SAPIEN 3 valves possibly due to the presence of an external sealing cuff.18
Obviously, anatomical factors are important for the occurrence of PVL. We observed that larger LVOT/AAo angles were associated with a higher rate of PVL, particularly with the Evolut PRO valve. Sherif et al. demonstrated that the risk of PVL increases with larger LVOT/AAo angles.10 We also observed that the LVOT/AAo angle affects implantation depth in association with the NCC with the Evolut PRO, but not with the SAPIEN 3 valves. It is quite conceivable that implantation depth impacts the rate of PVL.
Sherif et al. were the first ones to report on the association between increased AA angles and postoperative PVL with self-expanding valves.10 A subsequent retrospective study conducted by Abramowitz et al. described a higher rate of complications (eg, postoperative PVL in patients with horizontal aortas (defined by an AA ≥ 48º as seen on the cardiac CT scan) who received self-expanding valves.11 We observed that AA angles impacted PVL in patients who received Evolut PRO valves even if these angles were < 48º with no significant differences in the rate of PVL for AA angles < 48º or ≥ 48º.
In this study we also observed 6 patients with AA angles ≤ 30º (3 patients with Evolut PRO and 3 patients with SAPIEN 3). All of them were free of PVL immediately after valve deployment. One could speculate that AA angles ≤ 30º are the best for Evolut PRO valve implantation, but the small size of the sample prevents us from drawing any definitive conclusions.
In our study, the rates of device success determined by the absence of a significant PVL (≥ grade II) at hospital discharge, need for a second valve, valve embolization, the performance of the prosthetic heart valve, and the mortality rate according to VARC definition9 were 86% and 98% with the Evolut PRO and SAPIEN 3 valve, respectively. Similarly, Li et. al found a high device success rate for both the SAPIEN 3 and the Evolut R valve (94% and 96%, respectively).19
We found similar rates of postoperative conduction defects and PPI for both Evolut PRO and SAPIEN 3 valve types (7.8% and 5.1%, respectively). Popma et al.20 and Vlastra et al.21 reported lower rates of PPI with new generation balloon expandable valves compared to new-generation self-expanding valves. The comparable rates of conduction defects and PPI with either valve in our study was probably due to the lower implantation depth of Evolut PRO valves.
Li et al. reported higher rates of postdilatation of up to 30% with the Evolut R compared to the SAPIEN 3 valve.19 This was not seen in our study (15.7% and 5.1%, respectively; P = .35). This was probably so thanks to the proper positioning of the Evolut PRO valve and routine predilatation in all our cases.
In this study, in-hospital mortality was similar in both valve groups. Li et al. also reported that mortality was not associated with the type of valve implanted.19 The CHOICE trial also showed a comparable mortality rate with the use of older-generation valves (CoreValve and SAPIEN XT).15
The rates of stroke were similar for both the Evolut PRO and the SAPIEN 3 valve and lower compared to those seen with older generation devices.15,19,22,23 The operators’ experience and improved delivery systems are likely to account for the reduced risk of thromboembolic complications.
Regardless of the type of valve used, acute kidney injury seemed to be slightly more common in our study (5.9% and 3.5% for the Evolut PRO and the SAPIEN 3, respectively) than previously reported. Husser et al.24 noted a rate of 2.7% in SAPIEN 3 valves while Kodali et al.25 reported rates of 1.7%. However, large multicenter studies usually have stricter inclusion criteria so the baseline kidney function of the patients included was better.19
Despite increased sheath/femoral artery ratios with the Evolut PRO valve, the rate of bleeding or vascular complications was similar compared to the SAPIEN 3 valve. Similar results were reported by Li et al.19 and Panchal et al.26
This was a single-center study with a small sample size and limited statistical power. As routine computed tomography scan was not part of our study, specific information on the anatomy of the aortic root was not available and no adjustment was performed based on the annular dimensions or degree/distribution of aortic annular calcification. Also, angiography-based measurements of the LVOT/AAo and AA angles may be inaccurate. However, this may have helped exclude selection bias as some operators are reluctant to use self-expanding valves in view of heavy calcifications or severe angulation.
Follow-up was limited to the length of stay (average 1 week). However, this seems reasonable since we focused on procedural aspects. Furthermore, in comparable studies, in-hospital outcome and 30-day follow-up results were quite similar.
This randomized study demonstrated comparable procedural and in-hospital outcomes for the Evolut PRO and SAPIEN 3 valves except for a significantly higher rate of PVL associated with the Evolut PRO valves. The PVL reported was associated with the LVOT/AAo angle in Evolut PRO group, which also impacted negatively the implantation depth of this type of valve.
None whatsoever.
Idea and design: H. M. Elnaggar, M. S. Mahmoud, W. Schoels, and Y. T. Kishk. Administrative support: W. Schoels, M. Kullmer, and M. Dia. Provision of study materials or patients: M. S. Mahmoud, M. Algowhary, and H. M. Elnaggar. Data collection and assembly: M. S. Mahmoud, M. Kullmer, and M. Dia. Data analysis and interpretation: M. S. Mahmoud, Y. T. Kishk, M. Algowhary, and H. M. Elnaggar. Manuscript drafting and final approval: all authors.
None reported.
1. Athappan G, Patvardhan E, Tuzcu EM, et al. Incidence, predictors, and outcomes of aortic regurgitation after transcatheter aortic valve replacement: meta-analysis and systematic review of literature. J Am Coll Cardiol. 2013;61:1585-1595.
2. Herrmann HC, Abdel-Wahab M, Attizzani GF, et al, Rationale and design of the SMall Annuli Randomized to Evolut or SAPIEN Trial (SMART Trial). Am Heart J. 2022;243:92-102.
3. Paitazoglou C, Meincke F, Thorsten Hanke M, et al. The ALSTER-TAVI All-Comers Registry: Procedural and 1-Year Clinical Outcomes of Balloon-Expandable vs Self-Expanding Contemporary TAVI Valves. J Invasive Cardiol. 2021;33:E356-E364.
4. Mahmoud MS, Kishk YT, Algowhary M, et al. Balloon Sizing for Transcatheter Aortic Valve Implantation Using 3 rd Generation Valves, Does It Still Work? Int Med J. 2021;28:604-609.
5. Détaint D, Lepage L, Himbert D, et al. Determinants of significant paravalvular regurgitation after transcatheter aortic valve implantation: impact of device and annulus discongruence. JACC Cardiovasc Interv. 2009;2:821-827.
6. Wang J, Yu W, Jin Q, et al. Risk factors for post-TAVI bleeding according to the VARC-2 bleeding definition and effect of the bleeding on short-term mortality: a meta-analysis. Can J Cardiol. 2017;33:525-534.
7. Sellers RD, Levy MJ, Amplatz K, Lillehei CW. Left retrograde cardioangiography in acquired cardiac disease: Technic, indications and interpretations in 700 cases. Am J Cardiol. 1964;14:437-447.
8. Sinning JM, Hammerstingl C, Vasa-Nicotera M, et al. Aortic regurgitation index defines severity of peri-prosthetic regurgitation and predicts outcome in patients after transcatheter aortic valve implantation. J Am Col Cardiol. 2012;59:1134-1141.
9. Kappetein AP, Head SJ, Généreux P, et al. Updated standardized endpoint definitions for transcatheter aortic valve implantation: the Valve Academic Research Consortium-2 consensus document. J Thorac Cardiovasc Surg. 2013;145:6-23.
10. Sherif MA, Abdel-Wahab M, Stöcker B, et al. Anatomic and procedural predictors of paravalvular aortic regurgitation after implantation of the Medtronic CoreValve bioprosthesis. J Am Col Cardiol. 2010;56:1623-1629.
11. Abramowitz Y, Maeno Y, Chakravarty T, et al., Aortic angulation attenuates procedural success following self-expandable but not balloon-expandable TAVR. JACC Cardiovasc Imaging. 2016;9:964-972.
12. Di Stefano D, Colombo A, Mangieri A, et al. Impact of horizontal aorta on procedural and clinical outcomes in second-generation transcatheter aortic valve implantation. EuroIntervention. 2019;15:e749-e756.
13. Mostafa AE, Richardt G, and Abdel-Wahab M. Clinical utility of a predictive model for paravalvular aortic regurgitation after transcatheter aortic valve implantation with a self-expandable prosthesis. Egypt Heart J. 2017;69:253-259.
14. Reardon MJ, Van Mieghem NM, Popma JJ, et al. Surgical or transcatheter aortic-valve replacement in intermediate-risk patients. N Engl J Med. 2017;376:1321-1331.
15. Abdel-Wahab M, Mehilli J, Frerker C, et al. Comparison of balloon-expandable vs self-expandable valves in patients undergoing transcatheter aortic valve replacement: the CHOICE randomized clinical trial. JAMA Cardiol. 2014;311:1503-1514.
16. Webb J, Wood D, Sathananthan J, Landes U. Balloon-expandable or self-expandable transcatheter heart valves. Which are best? Eur Heart J. 2020;41:1900-1902.
17. Jiang T, Hasan SM, Faluk M, Patel J. Evolution of Transcatheter Aortic Valve Replacement| Review of Literature. Curr Probl Cardiol. 2021;46:100600.
18. Enríquez-Rodríguez E, Amat-Santos IJ Jiménez-Quevedo P, et al. Comparison of the hemodynamic performance of the balloon-expandable SAPIEN 3 versus self-expandable Evolut R transcatheter valve: a case-matched study. Rev Esp Cardiol. 2018;71:735-742.
19. Li Y-M, Tsauo J-Y, Liao Y-B, Zhao Z-G, Chen M. Comparison of Third Generation Balloon-Expandable Edwards Sapien 3 Versus Self-Expandable Evolut R in Transcatheter Aortic Valve Implantation: A Meta-Analysis. Ann Palliat Med. 2020;9:700-708.
20. Popma JJ, Reardon MJ, Khabbaz K, et al. Early clinical outcomes after transcatheter aortic valve replacement using a novel self-expanding bioprosthesis in patients with severe aortic stenosis who are suboptimal for surgery: results of the Evolut R US study. JACC Cardiovasc Interv. 2017;10:268-275.
21. Vlastra W, Chandrasekhar J, Muñoz-Garcia AJ, et al. Comparison of balloon-expandable vs. self-expandable valves in patients undergoing transfemoral transcatheter aortic valve implantation: from the CENTER-collaboration. Eur Heart J. 2019;40:456-465.
22. Smith CR, Leon MB, Mack MJ, et al. Transcatheter versus surgical aortic-valve replacement in high-risk patients. N Engl J Med. 2011;364:2187-2198.
23. Adams DH, Popma JJ, Reardon MJ, et al. Transcatheter aortic-valve replacement with a self-expanding prosthesis. N Engl J Med. 2014;370:1790-1798.
24. Husser O, Kim WK, et al. Multicenter comparison of novel self-expanding versus balloon-expandable transcatheter heart valves. JACC Cardiovasc Interv. 2017;10:2078-2087.
25. Kodali S, Thourani VH, White J, et al. Early clinical and echocardiographic outcomes after SAPIEN 3 transcatheter aortic valve replacement in inoperable, high-risk and intermediate-risk patients with aortic stenosis. Eur Heart J. 2016;37:2252-2262.
26. Panchal HB, Barry N, Bhatheja S, Albalbissi K, Mukherjee D, Paul T. Mortality and major adverse cardiovascular events after transcatheter aortic valve replacement using Edwards valve versus CoreValve: A meta-analysis. Cardiovasc Revasc Med. 2016;17:24-33.
* Corresponding author. E-mail address: marwancordio@aun.edu.eg (M.S. Mahmoud).
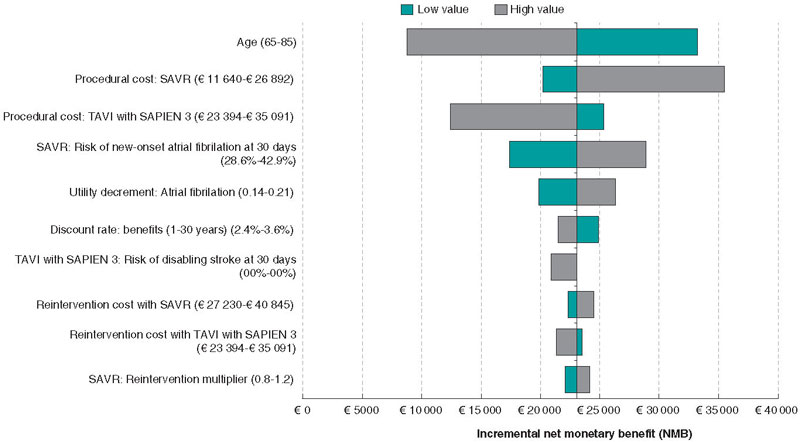
Introduction and objectives: Transcatheter aortic valve implantation (TAVI) was first introduced in 2007 as an alternative to open heart surgery to treat patients with severe symptomatic aortic stenosis (sSAS) with various indication expansions since that date. Recently, the PARTNER 3 study (Placement of aortic transcatheter valve) demonstrated clinical benefits with TAVI with the SAPIEN 3 valve vs surgical aortic valve replacement (SAVR) in selected low surgical mortality risk patients. We reviewed data from the PARTNER 3 and economic data from Spain to assess the cost-effectiveness ratio of TAVI vs SAVR in patients with sSAS and low surgical mortality risk.
Methods: A 2-stage model was used to estimate direct healthcare costs and health-related quality of life data regarding TAVI with the SAPIEN 3 valve and SAVR. Early adverse events associated with TAVI from the PARTNER 3 were fed into a Markov model that captured longer-term outcomes after TAVI or SAVR.
Results: TAVI with SAPIEN 3 improved quality-adjusted life years per patient (+ 1.00) with an increase in costs vs SAVR (€6971 per patient). This meant an incremental cost-effectiveness ratio/quality-adjusted life year of €6952 per patient. The results were robust with TAVI with the SAPIEN 3 valve remaining cost-effective across several sensitivity analyses.
Conclusions: TAVI with the SAPIEN 3 valve is cost effective compared to SAVR in patients with sSAS and low surgical mortality risk. These findings can inform policymakers to facilitate policy development in Spain on intervention selection in this patient population.
Keywords: Spain. Transcatheter aortic valve replacement. Heart procedures and surgeries. Prosthetic heart valve. Surgical aortic valve replacement. Cost-benefit analysis. Aortic stenosis. Low-risk.
Introducción y objetivos: El implante percutáneo de válvula aórtica (TAVI) se introdujo en 2007 como una alternativa a la cirugía a corazón abierto para tratar a pacientes con estenosis aórtica grave sintomática, y desde entonces han aumentado las indicaciones autorizadas. Recientemente, el Placement of Aortic Transcatheter Valve Study (PARTNER) 3 ha demostrado beneficios clínicos con el TAVI con la válvula SAPIEN 3 frente al reemplazo quirúrgico de válvula aórtica (RVAo) en pacientes seleccionados con bajo riesgo de mortalidad quirúrgica. Utilizando los datos del PARTNER 3 junto con datos económicos de España, se evaluó la relación coste-efectividad del TAVI en comparación con el RVAo en pacientes con estenosis aórtica grave sintomática con bajo riesgo de mortalidad quirúrgica.
Métodos: Se utilizó un modelo en dos etapas para estimar los costes directos sanitarios y los datos de calidad de vida relacionados con la salud para TAVI con la válvula SAPIEN 3 y RVAo. Los eventos adversos tempranos relacionados con TAVI del PARTNER 3 se incluyeron en un modelo de Markov, que capturó los resultados a más largo plazo tras TAVI o RVAo.
Resultados: El TAVI con SAPIEN 3 mejoró los años de vida ajustados por calidad por paciente (+1,00), con un aumento en el coste frente al RVAo de 6.971 € por paciente. Esto representó una ratio coste-efectividad incremental por año de vida ganado ajustado por calidad de 6.952€ por paciente. Los resultados fueron robustos en los diversos análisis de sensibilidad realizados, en los que el TAVI con SAPIEN 3 se mantiene como una opción coste-efectiva.
Conclusiones: El TAVI con SAPIEN 3 es coste-efectivo en comparación con el RVAo en pacientes con estenosis aórtica grave sintomática con bajo riesgo de mortalidad quirúrgica. Estos resultados pueden informar a los decisores políticos en España para facilitar el desarrollo de políticas sobre la selección de opciones terapéuticas en esta población de pacientes.
Palabras clave: España. Implante percutáneo de válvula aórtica. Cirugía cardiaca. Prótesis valvular cardiaca. Reemplazo quirúrgico de válvula aórtica. Análisis coste-beneficio. Análisis coste-efectividad. Estenosis aórtica. Bajo riesgo.
Abbreviations
ICER: incremental cost-effectiveness ratio. QALYs: quality-adjusted life years. SAVR: surgical aortic valve replacement. sSAS: severe symptomatic aortic stenosis. TAVI: transcatheter aortic valve implantation.
Aortic stenosis affects nearly 3% of adults aged > 65 years.1 It often has an initial asymptomatic latent period, but as the disease becomes worse, signs of heart failure, angina, or syncope become evident.1,2 Aortic valve replacement is recommended for most symptomatic patients with echocardiographic evidence of significant aortic stenosis as well as for some asymptomatic patients.1,2
Since the first transcatheter aortic valve implantation (TAVI) was used as a treatment option for severe symptomatic aortic stenosis (sSAS) almost 20 years ago, clinical trial evidence has further increased and continued to validate its use.3 In 2013, TAVI became the treatment of choice for inoperable patients with sSAS, and high surgical mortality risk patients. More recently, this treatment choice has expanded to include patients of intermediate/low surgical mortality risk.4,5
The very recent Placement of aortic transcatheter valve study (PARTNER 3) is among the growing body of robust clinical trial evidence. This is a pivotal, multicenter, randomized, and controlled study in patients with sSAS of low surgical mortality risk.6,7 In PARTNER 3, treatment outcomes with surgical aortic valve replacement (SAVR) were compared to TAVI with the SAPIEN 3 transcatheter heart valve via transfemoral access.6,7 Compared to SAVR, TAVI with the SAPIEN 3 valve reduced the composite endpoint of death, stroke or rehospitalization after 1 and 2 years.6,7 In view of these positive clinical developments, the European Society of Cardiology (ESC)/European Association for Cardio-Thoracic Surgery (EACTS) guidelines now recommend SAVR in younger, low-risk patients, while TAVI is now the treatment of choice in older patients. Also, it can be considered in all other patients with sSAS following careful evaluation of individual clinical, anatomical, and procedural characteristics by the heart team.5
There are no treatment guidelines specific to Spain describing the use of TAVI, but the Spanish Society of Cardiology, as a member of the ESC, endorses the ESC guidelines, and healthcare professionals in Spain follow these ESC guidelines.5 Irrespective of these guidelines, TAVI adoption in Spain remains low compared to other European countries. Despite a higher level of infrastructure available,8 defined as the number of TAVI centres available per million population, there is still significant variability among regions regarding TAVI implantation rates in Spain.9 In 2021, nearly 5000 patients benefited from this transformative minimally invasive technology in Spain. In a recent publication,10 the annual number of TAVI candidates for Spain was estimated at 15 783 patients including low-risk patients. Considering this together with the increasingly evident clinical benefits of TAVI in patients with sSAS, it is important to evaluate the cost-effectiveness ratio of using TAVI vs SAVR for the low surgical risk sSAS patient group for whom TAVI is now advised in recent guidelines.5 Furthermore, compared to SAVR, transfemoral TAVI with the SAPIEN 3 valve has proven cost-effective in the high-and-intermediate-risk population in Spain.11 This further accentuates the need for evidence on the cost-effectiveness ratio of TAVI with the SAPIEN 3 valve in the low surgical risk population of patients with sSAS in Spain. Therefore, the objective of this article is to review the PARTNER 3 data and the economic data from Spain to assess the cost-effectiveness ratio of using TAVI vs SAVR in patients with sSAS and low surgical mortality risk.
A cost-utility analysis was developed using methodology validated for the French12 and Italian13 population to estimate changes in both direct healthcare costs and health-related quality of life with the use of TAVI with the SAPIEN 3 valve compared to SAVR in patients with sSAS and low surgical mortality risk (Society of Thoracic Surgeons < 4%) from the perspective of the Spanish National Health System. Costs were measured in 2021 euros and benefits in quality-adjusted life years (QALYs) gained. The incremental cost-effectiveness ratio (ICER) was calculated by dividing the difference in costs between the 2 treatment groups by the difference in QALYs. Consistent with previous studies,11,14 an incremental cost-effectiveness ratio of < €30 000 per QALY gained was used as the willingness-to-pay (WTP) threshold of acceptable cost-effectiveness.
Details of the 2-stage model structure have been previously described for the French population.12 In brief, early adverse events associated with TAVI were first captured using the 30-day early adverse events dataset from the PARTNER 3 study6 in a decision tree (figure 1A); subsequently, these data were fed into a Markov model that included 4 distinct health states (‘alive and well’, ‘treated atrial fibrillation [AF]’, ‘disabling stroke’, and ‘dead’) to capture longer-term outcomes of patients after TAVI or SAVR (figure 1B). The model was considered appropriate for the Spanish setting by all authors based on their clinical and health-economic expertise.
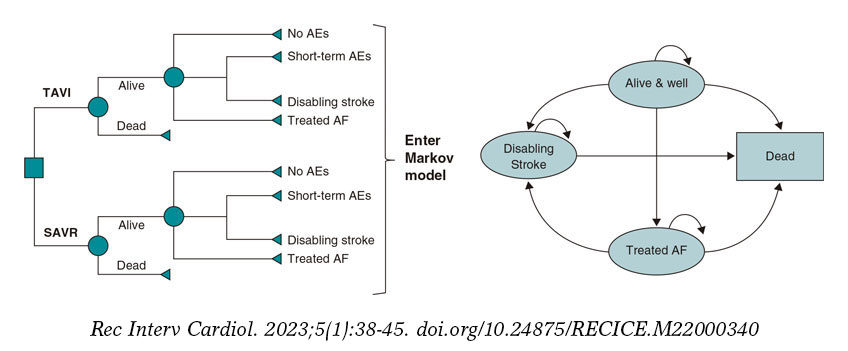
Figure 1. Central illustration. The cost-effectiveness model had 2 stages: a) early AEs from the PARTNER 3 trial were captured in a decision tree, which fed into b) a Markov model that captured longer-term outcomes of patients categorized into 4 different health states: ‘Alive and well’= patients who have undergone the procedure and survived with only short-term or no AEs; patients in this health state can transition to ‘disabling stroke’, ‘AF’ or ‘dead’ at any time during the model timespan. ‘Treated AF’= patients who have undergone the procedure and survived, but developed AF requiring specific treatment; this can either occur within the first 30 days or during the rest of the model timespan, and patients in this health state can transition to ‘disabling stroke’ or ‘dead’ at any time during the model timespan. ‘Disabling stroke’ = patients who have undergone the procedure and survived, but had a disabling stroke; this can either occur within the first 30 days or during the rest of the timespan of the model, and patients in this health state can only transition into the ‘dead’ state at any time during the model timespan. ‘Dead’ = this is the absorbing state in the model: all patients in the model are at risk of dying due to general all-cause mortality; patients with treated AF and stroke are at an increased risk of dying.
Reproduced from Gilard M, et al. Value Health 202112 under the terms of the creative commons licence.44 AE, adverse event; AF, atrial fibrillation; SAVR, surgical aortic valve replacement; TAVI, transcatheter aortic valve implantation.
Given that sSAS requires life-long valve replacement, a lifetime timespan of 50 years was selected for the cost-utility analysis with a discounting factor per year of 3% applied for both future costs and benefits following the recommendations set for Spain.15 This timespan was chosen to reflect all potential consequences to individuals with sSAS over their lifetime. Healthcare costs and health-related quality of life was measured using QALYs.
The model was informed by the PARTNER 3 study population, which excluded patients with clinical frailty, bicuspid aortic valves or other anatomical features that increased the risk of complications associated with either surgery or TAVI. In the PARTNER 3, 1000 patients were enrolled, 503 of whom were randomized to TAVI and 497 to SAVR, with ‘as treated’ groups of 496 and 454 patients, respectively.6 The primary endpoint was a composite of all-cause mortality, stroke or rehospitalization 1 year after the procedure.
Probabilities of clinical events used in the model (table 1 of the supplementary data) were based on a decision tree that captured all early adverse events experienced up to 30 days after the procedure as reported in the PARTNER 3. Monthly transition probabilities among the Markov model health states were estimated. Regarding the transition from ‘alive and well’ to ‘treated AF’, data from the PARTNER 3 on new-onset treated AF between 30 days and 1 year were used.6 Other literature sources provided a more realistic estimate of the remaining 2 transitions due to the scarcity of these events reported in the PARTNER 3. Burden of stroke data in Spain (Stroke Alliance for Europe)16 were used for the transition from ‘alive and well’ to ‘disabling stroke’, and data from a systematic review/meta-analysis involving 104 eligible cohort studies were used for the transition from ‘treated AF’ to ‘disabling stroke’.17 Myocardial infarction, transient ischemic attack, and severe or life-threatening bleeding were captured as intercurrent events between 30 days and 1 year from PARTNER 3 data.6 Other relevant events like rehospitalization rates using data from the PARTNER 3,6 and reintervention rates due to valve deterioration (data up to 2 years from the PARTNER 3)6,7 and from 3 years onwards from a study on 20-year outcomes of pericardial aortic tissue valve bioprosthesis18 were also considered (table 1 of the supplementary data). In the base case, the same reintervention rate was used for both the TAVI and SAVR arms; this simplifying assumption allowed better use of the available data. In scenario #1, higher reintervention rates were assumed for TAVI with the SAPIEN 3 valve compared to SAVR based on data from the PARTNER 2 at 5 years19 while in scenario #2, an increased risk of stroke was assumed, which was consistent with the PARTNER 3 outcomes.
Table 1. Base case results with acute and lifetime costs
| Summary results | TAVI with SAPIEN 3 | SAVR | Incremental |
|---|---|---|---|
| Cost per patient | € 39 052 | € 32 081 | € 6971 |
| Life year gained (undiscounted) | 14.08 | 13.22 | 0.86 |
| Median survival (years) | 16.50 | 14.50 | 2.00 |
| QALYs per patient | 8.66 | 7.66 | 1.00 |
| Incremental cost effectiveness ratio (ICER) | € 6952 | ||
| Incremental net monetary benefit (NMB) | € 23 111 | ||
| Incremental net health benefit (NHB) | 0.77 | ||
| Acute phase cost (first hospitalization and rehabilitation) | |||
| Index hospitalization | € 24 781 | € 13 779 | € 11 003 |
| Rehabilitation | € 114 | € 461 | -€ 347 |
| Pacemaker implantation | € 506 | € 311 | € 195 |
| Acute phase costs | € 25 401 | € 14 550 | € 10 656 |
| Additional costs at 1 year | |||
| MI | € 181 | € 92 | € 89 |
| Pacemaker implantation complication costs | € 38 | € 23 | € 15 |
| Hospitalization costs | € 212 | € 316 | -€ 104 |
| Reintervention costs | € 117 | € 147 | -€ 30 |
| Alive and well health state costs | € 1 258 | € 844 | € 415 |
| Treated AF health state costs | € 48 | € 376 | -€ 328 |
| Disabling stroke costs | € 11 | € 221 | -€ 210 |
| Death costs | € 0 | € 0 | € 0 |
| Overall cost at 1 year | € 27 267 | € 16 570 | € 10 698 |
| Additional lifetime costs | |||
| Pacemaker implantation complication costs | € 433 | € 251 | € 182 |
| Hospitalization costs | € 374 | € 353 | € 21 |
| Reintervention costs | € 4464 | € 4941 | -€ 477 |
| Alive & well health state costs | € 4120 | € 2590 | € 1530 |
| Treated AF health state costs | € 970 | € 3963 | -€ 2993 |
| Disabling stroke costs | € 1424 | € 3414 | -€ 1990 |
| Additional lifetime costs | € 11 785 | € 15 512 | -€ 3727 |
| Total lifetime costs | € 39 052 | € 32 081 | € 6971 |
|
AF, atrial fibrillation; MI, myocardial infarction; QALY, quality-adjusted life-year. |
|||
There were 2 options regarding survival extrapolation. In option #1, transition probabilities were taken from the literature (relative risk of death with AF of 1.517; and relative risk of death with disabling stroke of 2.0520). In option #2, parametric survival fitting was performed based on Kaplan-Meier data from the PARTNER 3. A total of 3 parametric distributions were used (Weibull, Exponential, Gompertz) and adjusted to the survival of the overall Spanish population. Therefore, in the base case, survival estimates were based on transition probabilities due to immaturity of survival data from the trial. Annual mortality risk for ‘alive and well’, and other relative risks for other health states are shown on table 2 of the supplementary data. Option #2 (parametric survival analysis) was explored using alternative hazard ratios (HR) in scenario #3: HR, 0.75 from the PARTNER 3 at 2 years adjusted to Spanish population overall mortality. An additional scenario #4 removed any survival benefit with the SAPIEN 3 valve (HR, 1).
There were 2 options for determining utility decrement: option #1 used utility decrements by health state from the literature adjusted by age and Spanish population standards.21 This was the preferred option because there were very few corresponding events in the PARTNER 3, and estimates from the literature were deemed realistic. The age and population standards adjusted utility decrements were 0.16 for AF22 and 0.42 for disabling stroke.23 Option #2 used treatment options from the PARTNER 3 and was explored within scenario #5. The utility decrement for option #2 was individually extracted from the PARTNER 3 at baseline, after 30 days, 6 months and 1 year, and then converted to Spanish health utilities.24
Costs associated with TAVI and SAVR (procedure, complications, and long-term) are shown on table 3 of the supplementary data. Base case procedure cost information was drawn from the SERGAS.25 We should mention that the SERGAS fee includes market valve and ancillary material price. Also, personnel costs were additionally estimated on a per hour price basis for different professionals. Costs corresponding to complications and health states were drawn from the literature and diagnosis-related groups (DRG). The breakdown of TAVI and SAVR procedure costs are shown on table 4 of the supplementary data. The micro-cost elements are informed from the study conducted by Bayón et al.26 and updated to reflect current TAVI practice in Spanish low-risk patients with sSAS. As costs vary depending on the Spanish region at stake, 3 additional scenarios: 6A, 6B, and 6C were explored using cost information adjusted to reflect current clinical practice in Murcia, Huelva, and Basque regions. Furthermore, a scenario #7 was included to account for early adverse events costs at 30 days.
Key outputs of the model were the overall per-patient costs and QALYs in each arm and ICER.
To evaluate uncertainty, 1-way deterministic sensitivity analyses were performed by varying inputs using confidence intervals and ranges from the literature when available, and plausible ranges when data were unavailable (table 5 of the supplementary data). Multiple parameters were changed and the impact on the results explored. Overall parameter uncertainty was addressed using a probabilistic sensitivity analysis (PSA) (table 6 of the supplementary data). Several scenario analyses were conducted to explore the impact of major structural assumptions as shown on table 7 of the supplementary data. All analyses were performed using Microsoft Excel (Microsoft Corporation, United States).
TAVI with SAPIEN 3 improved QALYs per patient (+ 1.0) with higher costs compared to SAVR of approximately €6971 per patient. This represented an ICER of €6952 per QALY, which is lower compared to the WTP threshold of €30 000/QALY that is commonly referenced in the Spanish setting. Base case results over a 50-year timespan are shown on table 1. Further examination of the breakdown of costs for TAVI vs SAVR revealed that although initial procedural costs in the model were higher with TAVI, costs associated with ‘disabling stroke’ and ‘treated AF’ were somehow lower (table 1, and figure 1 of the supplementary data).
Univariate sensitivity analyses are displayed in the Tornado diagram (figure 2). SAPIEN 3 TAVI remained cost-effective regardless of any plausible changes to individual model parameters (note: the 20 parameters with the greatest influence on the model are shown on the diagram). The model was most sensitive to age, SAVR procedural costs, and risk of disabling stroke at 30 days with TAVI.
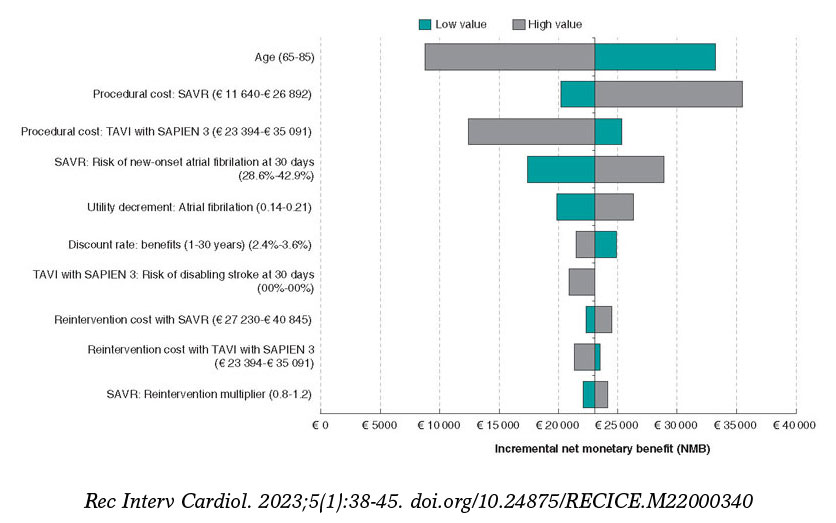
Figure 2. Tornado diagram showing the 20 parameters with greatest influence on the model (deterministic sensitivity analysis).
The results of the PSA confirm the results of the base case analysis. At the conventional WTP threshold of €30 000/QALY, TAVI with SAPIEN 3 remains cost-effective compared to SAVR in 100% of the simulations run in the model (figure 3A). In addition, the cost-effectiveness acceptability curve indicates that SAPIEN 3 TAVI has a 99.9% probability of treatment being cost-effective with a €30 000/QALY WTP threshold (figure 3B). PSA assumptions are shown on table 5 of the supplementary data.
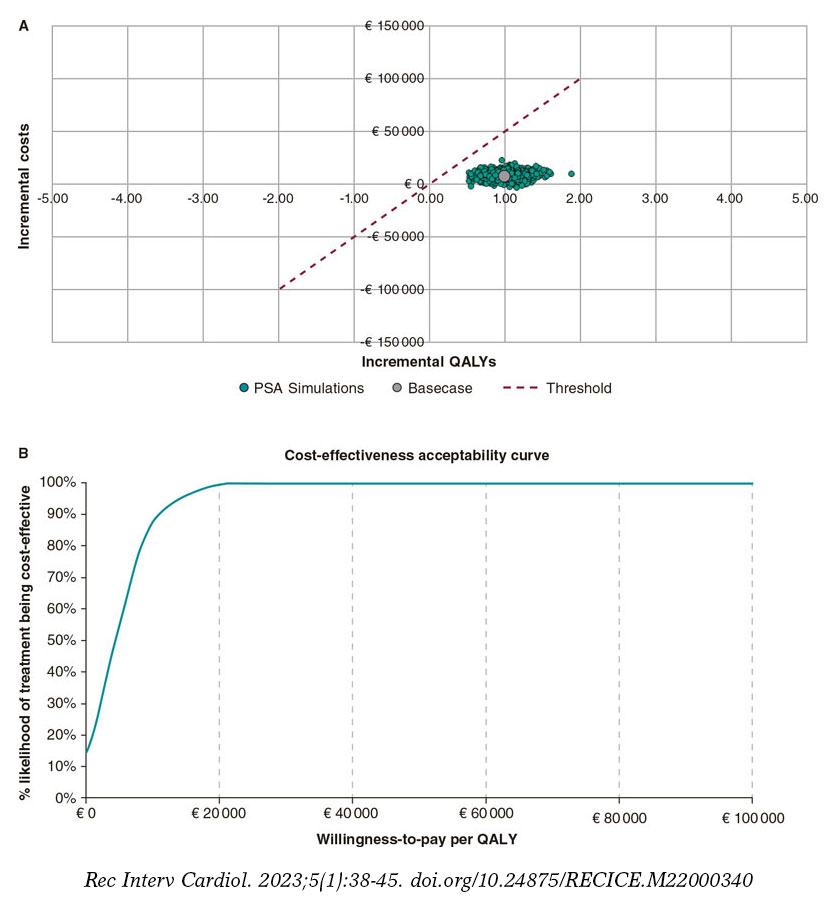
Figure 3. Probabilistic sensitivity analysis: A: cost-effectiveness scatter plot; and B: cost-effectiveness acceptability curve. PSA, probabilistic sensitivity analysis; QALY, quality-adjusted life years.
A series of different scenario analyses were conducted to assess the impact of changing various assumptions on the results of the model and the model robustness. TAVI with the SAPIEN 3 valve remains cost-effective compared to SAVR across most of the tested scenarios (table 6 of the supplementary data) including those with different timespans (10, 15, 20, and 30 years). The results from the scenario analyses demonstrate the comparative robustness of the model reported.
This analysis suggests that TAVI with the SAPIEN 3 vavle is likely to be a cost-effective valve replacement option for patients with sSAS and low surgical mortality risk in Spain. TAVI with the SAPIEN 3 valve showed an improvement in QALYs (+ 1.0) associated with slightly increased costs compared to SAVR (approximately €6971 per patient). The ICER benefits for TAVI with the SAPIEN 3 shown in this model represent a highly cost-effective intervention (ICER/QALY €6 952) in the Spanish system with a WTP threshold of €30 000/QALY. Uncertainty was assessed using various sensitivity analyses, and the results appeared robust.
The findings of the current study are supported by other cost-effectiveness studies that show that TAVI with SAPIEN 3 is either dominant or cost-effective in patients of low risk surgical mortality risk.27-31 The Spanish findings are also consistent with cost-effectiveness analyses of TAVI with SAPIEN 3 vs SAVR in France12 and Italy13 using the same model structure.
The current analysis is important because TAVI provides patients with a minimally invasive treatment option and a lower risk of complications and/or rehospitalization plus improved recovery rates and quality of life gains. From a provider perspective, TAVI also brings efficiencies by limiting healthcare resource use, reducing postoperative complications, and shortening hospital stays (including Intensive care unit [ICU] beds).32 Shortening the hospital stay allows more patients to be treated in the same hospital, an important element for a health system in high demand and with long waiting lists. These efficiencies also lead to a reduced risk of infections and contamination,33 which was much welcomed during the recent COVID-19 pandemic. Finally, TAVI reduces the recovery period to normal activity that may not be accounted for in this analysis. Indirect benefits like volunteering, grandchild support or less caregiving support most likely would increase even further the overall benefits of this technology.34
The results of this analysis could also enable greater access to TAVI for Spanish patients with sSAS. Recent studies demonstrate the efficacy and safety profile of transfemoral TAVI in Spain.9 This together with the recent European guidelines suggests that the number of TAVIs will increase, thus rendering many low surgical risk patients with sSAS eligible for TAVI. Moreover, with time, TAVI will likely become simplified even further with shorter admission times;35 this should lead to lower TAVI costs in the future. In this regard, the results of this study could inform policy makers on the management of patients with sSAS in Spain.
This study comes with certain limitations. The first pertains to certain model inputs and assumptions made. In this model, hospitalization data were based on 1- and 2-year data from the PARTNER 3 study with the assumption that this rate remained constant over the model timespan after 2 years. The impact of this assumption is unknown because individuals from both treatment arms in the model remained at risk of hospitalization. The rate of reinterventions was assumed to remain constant after 22 years; the impact of this assumption on modelled outcomes was deemed minimal based on the expectation that nearly 11% of patients would still be alive in the model after this point in time with limited need for reintervention. Despite of this, uncertainty on the longer-term durability of the TAVI device and subsequent reintervention rates in younger patients cannot be disregarded. Disutilities were not included for any intercurrent events because you can run the risk of counting them twice with the health state utilities being applied to patients in the ‘treated AF’ and ‘disabling stroke’ states. This was a conservative assumption because, apart from pacemaker complications, the rates of intercurrent events are generally lower for TAVI with SAPIEN 3 compared to SAVR.6
A second limitation of this study is the generalizability of the results. Conclusions cannot be generalised to the overall population with aortic stenosis because, among others, patients with unfavourable coronary anatomy were excluded from the PARTNER 3 study. Moreover, caution should be observed when trying to generalize any findings from this model to populations outside Spain.
Finally, we should mention that procedural costs across different regions of Spain are heterogenous. In this study, we use publicly available cost data from a region in Spain and our approach is conservative as we additionally account for current practice. We also conducted multiple scenario analyses with other available cost data sets.
Data from the PARTNER 3 suggested that the use of TAVI with the SAPIEN 3 valve was more favorable, on the clinical level, compared to SAVR in patients with sSAS and low surgical mortality risk. The results of this cost-effectiveness model indicate that, in Spain, TAVI could provide a cost-effective option over SAVR for this population with an estimated ICER/QALY value well below the national threshold. The model appeared to be robust with uncertainty assessed by various sensitivity analyses. The results of this cost-effectiveness analysis can support policy makers and healthcare budget holders to optimize the management of Spanish patients with sSAS.
Edwards Lifesciences SA, Switzerland provided funding for the economic assessment and was involved in the analysis as well as in the drafting of this manuscript.
J.M. Vázquez participated in economic data mining, model validation, and manuscript review. E Pinar in economic data mining, and model validation. J. Zamorano participated in data mining, and model validation. J. Burgos participated in data mining and model validation. J. Díaz participated in data mining, and model validation. B. García del Blanco participated in data mining, and model validation. A. Sarmah in data collection and analysis, result preparation, and manuscript drafting and review. P. Candolfi participated in cost analysis and manuscript drafting. J Shore was involved in model development and manuscript review. M. Green participated in model development, and manuscript drafting.
J.M. Vázquez Rodríguez declared department research or training grants from Edwards Lifesciences, Medtronic, and Boston Scientific, and personal advisory fees from Medtronic, and Boston Scientific. J.L. Zamorano declared research grants from Abbott, and Medtronic to the Institution, and speaker fees from Edwards Lifesciences, Bayer, Novo Nordisk, and Daiichi Sankyo. J. Moreu Burgos declared having received fees from Biosensors, Boston Scientific, Cardiva, Edwards Lifesciences, and Medtronic. A. Sarmah declared to be an employee of Edwards Lifesciences and hold stock options. P. Candolfi declared to be an employee of Edwards Lifesciences and hold stock option. J. Shore declared consultancy fees to the employer for developing the economic model. M. Green declared consultancy fees to the employer for developing the economic model. E. Pinar, J.F. Díaz-Fernández, and B. García del Blanco declared no conflicts of interest whatsoever.
Writing support was provided by Zenith Healthcare Communications Ltd (Chester, United Kingdom), and funded by Edwards Lifesciences.
1. Grimard BH, Larson JM. Aortic Stenosis: Diagnosis and Treatment. Am Fam Physician. 2016;93:371-378.
2. Marquis-Gravel G, Redfors B, Leon MB, Généreux P. Medical treatment of Aortic Stenosis. Circulation. 2016;134:1766-1784.
3. Cribier A. Development of Transcatheter Aortic Valve Implantation (TAVI): A 20-year Odyssey. Arch Cardiovasc Dis. 2012;105:146-152.
4. Falk, V, Baumgartner H, Bax, JJ, et al. 2017 ESC/EACTS Guidelines for the management of valvular heart disease. Eur J Cardiothorac Surg. 2017;52:616-664.
5. Beyersdorf F, Vahanian A, Milojevic M, et al. 2021 ESC/EACTS Guidelines for the Management of Valvular Heart Disease. Eur J Cardiothorac Surg. 2021;60:727-800.
6. Mack MJ, Leon MB, Thourani VH, et al. Transcatheter Aortic-Valve Replacement With a Balloon-Expandable Valve in Low-Risk Patients. N Engl J Med 2019;380:1695-1705.
7. Leon MB, Mack MJ, Hahn RT, et al. Outcomes 2 Years After Transcatheter Aortic Valve Replacement in Patients at Low Surgical Risk. J Am Coll Cardiol. 2021;77:1149-1161.
8. Ali N, Faour A, Rawlins J, et al. ‘Valve for Life’: tackling the deficit in transcatheter treatment of heart valve disease in the UK. Open Heart. 2021;8: e001547.
9. Íñiguez-Romo A, Javier Zueco-Gil J, Álvarez-Bartolomé M, et al. Outcomes of transcatheter aortic valve implantation in Spain through the Activity Registry of Specialized Health Care. REC Interv Cardiol. 2022;4:123-131.
10. Durko, AP, Osnabrugge RL, Van Mieghem NM, et al. Annual number of candidates for transcatheter aortic valve implantation per country: current estimates and future projections. Eur Heart J. 2018;39:2635-2642.
11. Pinar E, García de Lara J, Hurtado J, et al. Análisis coste-efectividad del implante percutáneo de válvula aórtica SAPIEN 3 en pacientes con estenosis aórtica grave sintomática. Rev Esp Cardiol. 2021;75:325-333.
12. Gilard M, Eltchaninoff H, Lung B, et al. Cost-Effectiveness Analysis of SAPIEN 3 Transcatheter Aortic Valve Implantation Procedure Compared with Surgery in Patients with Severe Aortic Stenosis at Low Risk of Surgical Mortality in France. Value Health. 2022;25:605-613.
13. Mennini FS, Meucci F, Gabriele Pesarini G, et al. Cost-effectiveness of transcatheter aortic valve implantation vs surgical aortic valve replacement in low surgical risk aortic stenosis patients. Int J Cardiol. 2022;357:26-32.
14. Sacristán JA, Oliva J, Del Llano J, Prieto L, Pinto JL. What is an efficient health technology in Spain? Gac Sanit. 2002;16:334-343.
15. Lopez-Bastida J, Oliva J, Antoñanzas F, et al. Spanish recommendations on economic evaluation of health technologies. Eur J Health Econ. 2010;11:513-20.
16. SAFE 2017. The Burden of Stroke in Spain. Available online: https://www.safestroke.eu/wp-content/uploads/2017/12/SAFE_STROKE_SPAIN.pdf. Acessed 22 May 2022.
17. Odutayo A, Wong CX, Hsiao AJ, et al. Atrial fibrillation and risks of cardiovascular disease, renal disease, and death: systematic review and meta-analysis. BMJ. 2016;354:i4482.
18. Bourguignon T, Bouquiaux-Stablo A-L, Candolfi P, et al. Very long-term outcomes of the Carpentier-Edwards Perimount valve in aortic position. Ann Thorac Surg. 2015;99:831-837.
19. Makkar RR, Thourani VH, Mack MJ, et al. Five-Year Outcomes of Transcatheter or Surgical Aortic-Valve Replacement. N Engl J Med. 2020;382:799-809.
20. de Andrés-Nogales F, Álvarez M, de Miquel MÁ, et al. Cost-effectiveness of mechanical thrombectomy using stent retriever after intravenous tissue plasminogen activator compared with intravenous tissue plasminogen activator alone in the treatment of acute ischaemic stroke due to large vessel occlusion in Spain. Eur Stroke J. 2017;2:272-284.
21. Szende A, Janssen B, Cabases J, editors. Self-Reported Population Health: An International Perspective based on EQ-5D. Dordrecht (NL): Springer; 2014. p. 30.
22. Oyagüez I, Suárez C, López-Sendón JL, et al. Cost-Effectiveness Analysis of Apixaban Vs Edoxaban in Patients with Atrial Fibrillation for Stroke Prevention. Pharmacoecon Open. 2020;4:485-497.
23. Lopez-Bastida J, Oliva Moreno J, Worbes Cerezo M, et al. Social and economic costs and health-related quality of life in stroke survivors in the Canary Islands, Spain. BMC Health Serv Res. 2012;12:315.
24. Ramos-Goñi JM, Craig BM, Oppe M, et al. Handling Data Quality Issues to Estimate the Spanish EQ-5D-5L Value Set Using a Hybrid Interval Regression Approach. Value Health. 2018;21:596-604.
25. SERGAS 2014. DECRETO 56/2014, de 30 de abril, por el que se establecen las tarifas de los servicios sanitarios prestados en los centros dependien-tes del Servicio Gallego de Salud y en las fundaciones públicas sanitarias. DOG 96. 2014. Available online: https://www.xunta.gal/dog/Publicados/2014/20140521/AnuncioC3K1-140514-0001_es.html. Accessed 22 May 2022.
26. Bayón Yusta JC, Gutiérrez Iglesias A, Mateos del Pino M, IIbarrola Gutiérrez MI, Gómez Inhiesto E, Acaiturri Ayesta MT. Análisis coste-efectividad del recambio valvular aórtico mediante prótesis valvular percutánea frente al tratamiento quirúrgico habitual. Ministerio de Sanidad, Servicios Sociales e Igualdad; Servicio de Evaluación de Tecnologías Sanitarias del País Vasco. Informes de Evaluación de Tecnologías Sanitarias: OSTEBA (2014). Available online: https://www.euskadi.eus/contenidos/informacion/biblioteca_central/es_9528/scp/215765.pdf Accessed 22 May 2022.
27. Tam DY, Azizi PM, Fremes SE, Chikwe J, Gaudino M, Wijeysundera HC. The Cost-Effectiveness of Transcatheter Aortic Valve Replacement in Low Surgical Risk Patients With Severe Aortic Stenosis. Eur Heart J Qual Care Clin Outcomes. 2021;7:556-563.
28. Zhou JY, Liew D, Duffy SJ, Walton A, Htun N, Stub D. Cost-Effectiveness of Transcatheter Vs Surgical Aortic Valve Replacement in Low-Risk Patients with Severe Aortic Stenosis. Heart Lung Circ. 2021;30:547-554.
29. Health Information and Quality Authority (HIQA) Health Technology Assessment of transcatheter aortic valve implantation (TAVI) in patients with severe symptomatic aortic stenosis at low and intermediate risk of surgical complications. 2019. Available online: https://www.hiqa.ie/sites/default/files/2019-12/TAVI_HTA.pdf. Accessed 22 May 2022.
30. Norwegian Institute of Public Health (NIPH) Transcatheter aortic valve implantation (TAVI) vs surgical aortic valve replacement (SAVR) for patients with severe aortic stenosis and low surgical risk and across surgical risk groups: a health technology assessment. 2021. Available online: https://www.fhi.no/en/publ/2021/TAVI-vs-SAVR-for-patients-with-severe-aortic-stenosis-and-low-surgical-risk-and-across-surgical-risk-groups/. Accessed 22 May 2022.
31. Haute Autorité de Santé (HAS) Traitement de la sténose aortique sévère symptomatique en France chez les patients à faible risqué chirurgical. 2021. Available online: https://www.has-sante.fr/upload/docs/application/pdf/2021-04/sapien3_9022021_avis_economique_vf2.pdf. Accessed 22 May 2022.
32. Valdebenito, M, Massalha E, Barbash IM et al. Transcatheter aortic valve implantation during the COVID-19 pandemic. Am J Cardiol. 2021;145:97-101.
33. Noad RL, Johnston N, McKinley A, et al. A pathway to earlier discharge following TAVI: Assessment of safety and resource utilization. Catheter Cardiovasc Interv. 2016;87:134-142.
34. Huygens SA, van der Kley F, Bekkers JA, Bogers AJJC, Tekkenberg JJM, Rutten-van Mölken MPMH. Beyond the clinical impact of aortic and pulmonary valve implantation: health-related quality of life, informal care and productivity. Eur J Cardiothorac Surg. 2019;55:751-759.
35. Martínez-Sellés M. Coste-efectividad del implante percutáneo de válvula aórtica en 2022. Rev Esp Cardiol. 2022;75(10):853.
36. Instituto Nacional de Estadística. National Life Tables Spain (2019) Available online: https://www.ine.es/dyngs/INEbase/en/operacion.htm?c=Estadistica_C&cid=1254736177004&menu=ultiDatos&idp=1254735573002. Accessed 22 May 2022.
37. de Andrés-Nogales F, Vivancos Mora J, Barriga Hernández FJ, et al. Use of healthcare resources and costs of acute cardioembolic stroke management in the Region of Madrid: The CODICE Study. Neurología. 2015;30:536-544.
38. Esquivias, GB, Albaladejo GE, Zamorano JL, et al. Cost-effectiveness analysis comparing apixaban and acenocoumarol in the prevention of stroke in patients with nonvalvular atrial fibrillation in Spain. Rev Esp Cardiol. 2015;68:680-690.
39. Rubio-Terrés, C, Graefenhain de Codeset R, Rubio-Rodríguez D, Evers T, Grau Cerrato SG. Cost-effectiveness analysis of rivaroxaban vs acenocoumarol in the prevention of stroke in patients with non-valvular atrial fibrillation in Spain. JHEOR. 2016;4:19-34.
40. Alvarez-Sabín J, Quintana M, Masiuan J, et al. Economic impact of patients admitted to stroke units in Spain. Eur J Health Econ. 2017;18:449-458.
41. Ministerio de Sanidad de España. GRD APR 190/191 (2019). Registro de Altas de los Hospitales Generales del Sistema Nacional de Salud. CMBD. Norma Estatal de Años Anteriores Available online: https://www.sanidad.gob.es/estadEstudios/estadisticas/cmbdAnteriores.htm. Accessed 22 May 2022.
42. Crespo C, Linhart M, Acosta J, et al. Optimisation of cardiac resynchronisation therapy device selection guided by cardiac magnetic resonance imaging: cost-effectiveness analysis. Eur J Prev Cardiol. 2020;27:622-632.
43. Leon MB, Smith CR, Mack MJ, et al. Transcatheter or Surgical Aortic-Valve Replacement in Intermediate-Risk Patients. N Engl J Med. 2016;374:1609-1620.
44. Attribution 4.0 International (CC BY 4.0). Available online: https://creativecommons.org/licenses/by/4.0/. Accessed 25 Aug 2022.
* Corresponding author.
E-mail address: archita_sarmah@edwards.com (A. Sarmah).
 @jmvazrod; @CorazonHuvr; @pepp183; @PascalCandolfi; @CIBER_CV
Departamento de Cardiología, Hospital de la Santa Creu i Sant Pau, Institut de Recerca Sant Pau (IR Sant Pau), Barcelona, Spain


Servicio de Cardiología, Hospital Regional Universitario de Málaga, Málaga, Spain

Servicio de Cardiología, Hospital Universitario Central de Asturias, Oviedo, Asturias, Spain


