
ABSTRACT
Introduction and objectives: Functional assessment of coronary stenosis severity with the piezo-electric sensor pressure wire has shown a discrepancy of up to 20% between hyperemic and nonhyperemic indexes. No data are available with fiber-optic pressure wires. The aim of this study was to evaluate the incidence and factors related to the diagnostic discordance between these indexes with a fiber-optic pressure wire. Secondary aims were to assess diagnostic reproducibility in 2 consecutive measurements of fractional flow reserve (FFR) and diastolic pressure ratio (dPR) and evaluate the drift rate.
Methods: We conducted a prospective, observational multicenter study in patients undergoing functional assessment with a fiber-optic pressure wire. We took 2 consecutive measurements of the dPR (cutoff point 0.89) and FFR (cut-off point 0.80) in each lesion analyzed. The diagnostic correlation between 2 measurements with the same technique and between the 2 techniques (dPR and FFR) was assessed. Clinical and angiographic factors associated with discordance (FFR−/dPR+ and FFR+/dPR−) between the 2 techniques were analyzed.
Results: We included 428 cases of stenosis (361 patients). Diagnostic reproducibility was 95.8% for the dPR, with a correlation coefficient between the 2 measurements (dPR1 and dPR2) of 0.974 (P < .0001). For FFR, the diagnostic reproducibility was 94.9% with a correlation coefficient (FFR1 and FFR2) of 0.942 (P < .0001). The diagnostic discordance was 18.2% (FFR+/dPR− 8.2% and FFR−/dPR+ 10%). Among the variables analyzed, the factors significantly associated with FFR−/dPR+ discordance in the multivariate analysis were hypertension and intracoronary adenosine. The only factors significantly associated with FFR+/dPR− discordance were age < 75 years and stenosis > 60%. The drift rate was 5.7%.
Conclusions: Although FFR and dPR measurements with a fiber-optic pressure wire have excellent reproducibility and a low drift rate, the discordance rate remains similar to those in previous studies with a piezo-electric pressure wire. FFR−/dPR+ discordance is associated with intracoronary adenosine and hypertension. FFR+/dPR− discordance is related to age < 75 years old and stenosis > 60%.
Keywords: Coronary physiology. Fractional flow reserve. Nonhyperemic index. Discordance. Drift.
RESUMEN
Introducción y objetivos: La valoración funcional de las estenosis coronarias con guías de presión de sensor piezoeléctrico ha mostrado hasta un 20% de discordancia entre los índices hiperémico y no hiperémico. No hay datos disponibles con guía de presión de sensor óptico. El objetivo del estudio es evaluar la incidencia y los factores relacionados con la discordancia diagnóstica entre estos índices con guía de presión de sensor óptico. Como objetivos secundarios se evaluó la reproducibilidad diagnóstica en dos determinaciones consecutivas de la reserva fraccional de flujo (RFF) y la diastolic pressure ratio (dPR). También se evaluó la tasa de drift.
Métodos: Estudio observacional, prospectivo, multicéntrico, en pacientes a quienes se realiza una valoración funcional con guía de presión de sensor óptico. Se hicieron dos mediciones consecutivas de dPR (umbral 0,89) y RFF (umbral 0,80) en cada lesión analizada. Se valoró la correlación diagnóstica entre dos mediciones con la misma técnica y entre ambas técnicas (dPR y RFF). Se analizaron factores clínicos y angiográficos asociados a la discordancia (RFF−/dPR+ y RFF+/dPR−) entre ambas técnicas.
Resultados: Se incluyeron 428 estenosis (361 pacientes). La reproducibilidad diagnóstica fue del 95,8% para dPR, con un coeficiente de correlación entre ambas mediciones (dPR1 y dPR2) de 0,974 (p < 0,0001). Para RFF la reproducibilidad diagnóstica fue del 94,9%, con un coeficiente de correlación (RFF1 y RFF2) de 0,942 (p < 0,0001). La discordancia diagnóstica fue del 18,2% (RFF+/dPR− 8,2% y RFF−/dPR+ 10%). Entre las variables analizadas, en el análisis multivariado, la hipertensión arterial y la administración intracoronaria de adenosina se asociaron de manera significativa con la discordancia RFF−/dPR+. Solo la edad < 75 años y la estenosis > 60% se asociaron de manera significativa con la discordancia RFF+/dPR−. La tasa de drift fue del 5,7%.
Conclusiones: Aunque las mediciones de RFF y dPR con guía de presión de sensor óptico tienen una excelente reproducibilidad y una baja incidencia de drift, la tasa de discordancia permanece similar a la de estudios previos con guía de presión de sensor piezoeléctrico. La adenosina intracoronaria y la hipertensión arterial se asocian con la discordancia RFF−/dPR+. La edad < 75 años y la estenosis > 60% se asocian a discordancia RFF+/dPR−.
Palabras clave: Fisiología coronaria. Reserva fraccional de flujo. Índice no hiperémico. Discordancia. Drift.
Abbreviations dPR: diastolic pressure ratio. FFR: fractional flow reserve. FOSW: fiber-optic sensor wire. iFR: instantaneous wave-free ratio: PPSW: piezoelectric pressure sensor wire.
INTRODUCTION
Fractional flow reserve (FFR) measurement is an invasive procedure performed during coronary angiography to determine the functional significance of coronary stenoses.
In recent years, the instantaneous wave-free ratio (iFR) resting index has been developed to assess the functional significance of coronary stenoses without the need for adenosine administration. The optimal iFR cutoff value—equivalent to 0.80 in FFR—was initially established at 0.89.1 In 2017, 2 clinical studies comparing FFR with iFR found no significant differences in clinical outcomes at follow-up.2-3 After the publication of these 2 studies, the European Society of Cardiology guidelines on myocardial revascularization4 assigned resting indices the same grade of recommendation as FFR for the functional assessment of coronary lesions.
Despite the validation of these 2 techniques in clinical trials and their inclusion in clinical practice guidelines, up to 20% discordance has been reported between iFR+/FFR− or iFR−/FFR+5 Several clinical factors, such as diabetes,6 and anatomical factors, such as lesion location in the left main or proximal left anterior descending coronary arteries, have been identified in association with this discordance.7
Previous studies comparing FFR with iFR using a piezoelectric pressure sensor wire (PPSW) calculated the mean distal-to-aortic pressure ratio beginning 25% into diastole and ending 5 ms before end diastole.1
Recently, a new resting index—the diastolic pressure ratio (dPR)—has been developed to calculate the mean distal-to-aortic pressure ratio over the entire diastolic phase (from the lowest point of the dicrotic notch up to 50 ms before the onset of the upstroke of the next beat)8 using a fiber-optic sensor wire (FOSW).
A study that compared the values of different resting indices (iFR, dPR, dPR25-75, dPRmid, iFRmatlab, iFR50ms, and iFR100ms) revealed that all were numerically identical,8 meaning that the results obtained with the iFR can be extrapolated to other resting indices.
To date, no study has compared the agreement between dPR and FFR measured using a FOSW. One advantage of the FOSW over the PPSW is the lower loss of mean pressure matching in the wire compared with the measurement obtained in the guide catheter (drift).9 Although various iFR studies state that drifts < ± 0.02 are considered acceptable, the drifts reported with the FOSW were even lower at < ± 0.01.10
The diagnostic reproducibility of PPSW decreases significantly when close to the threshold value of 0.80 and is approximately 80% when measurements are < 0.77 or > 0.83, and around 90% with values < 0.76 or > 0.84.11 Since the FOSW is less sensitive to changes in humidity and temperature, greater reproducibility of results can be expected when the measurement is repeated.
Considering that most discordant measurements have been associated with cutoff values, the better reproducibility of measurements and practically nonexistent drift of the FOSW can more accurately determine FFR and dPR measurements and reduce discrepancies.
METHODS
Study design
In this prospective, observational, and multicenter registry of consecutive coronary stenoses, we conducted a study with FOSW based on our routine clinical practice.
We included consecutive patients with clinical signs and coronary angiography findings suggesting the need for a functional study with a pressure wire. We excluded patients with cardiogenic shock, heart failure, severe anemia (hemoglobin < 10 mg/dL), heart rate < 50 or > 100 bpm, baseline systolic blood pressure < 90 mmHg or > 160 mmHg, severe coronary artery lesions in distal segments, and contraindications for the administration of adenosine.
Objective
The aim of this study was to evaluate the incidence and factors related to diagnostic discrepancies between these indices using the FOSW. Secondary aims consisted of assessing the diagnostic reproducibility of FOSW in 2 consecutive measurements of FFR and dPR and evaluating the drift rate.
Procedure
The study was approved by the Drugs Research Ethics Committee of the Basque Country (internal code PS 2019039). All patients received information on the study and were asked to sign a written informed consent form prior to their participation in the study.
We performed coronary angiography using standard methods, with visual estimation of severity after intracoronary nitroglycerin administration. We included lesions with up to 50% to 75% percent diameter stenosis and collected data on the reference luminal diameter, minimum luminal diameter, lesion length, calcification, and vessel tortuosity for each studied lesion.
We performed 2 consecutive measurements of dPR (threshold, 0.89) and FFR (threshold, 0.80) for each studied lesion and analyzed the clinical and angiographic factors to determine their correlation with discordance (FFR−/dPR+ and FFR+/dPR−). We took dPR1 and FFR1 as reference values for discrepancy analysis.
We conducted the FOSW functional study with 5-, 6-, or 7-Fr guide catheters without side holes, using an OptoWire (Opsens Medical, Canada). After advancing the wire toward the tip of the guide catheter, we removed the introducer sheath and flushed the system with saline solution to prevent damping of the pressure wire resulting in equal pressure of the wire and the guide catheter at the tip of the catheter. After advancing the pressure wire distally, we administered 200 μg of intracoronary nitroglycerin before taking any measurements. We took the 2 dPR measurements after waiting the necessary time to obtain confirmation of a stable baseline distal-to-aortic coronary pressure ratio (Pd/Pa).
Subsequently, we took 2 different FFR measurements. Hyperemia was induced according to standard practice in each center (through intracoronary or IV adenosine infusion). If intracoronary adenosine was infused, for the second measurement, we waited until the baseline heart rate, blood pressure, and Pd/Pa were regained and then infused the same dose of adenosine. If IV adenosine was infused, the infusion was stopped until baseline heart rate, blood pressure, and Pd/Pa were regained, and then we infused adenosine at the same rate.
We evaluated the presence of drift upon removal of the pressure wire from the guide catheter. Drift was defined as a difference in Pd/Pa of at least ± 0.02 upon removal of the pressure wire from the guide catheter. In the presence of significant drift, measurements were repeated.
Cutoff values
The cutoff value was ≤ 0.80 for FFR and ≤ 0.89 for dPR.10 We categorized all studied vessels based on dPR and FFR values into 4 groups: concordant positive group (FFR ≤ 0.80 and dPR ≤ 0.89), concordant negative group (FFR > 0.80 and dPR > 0.89), discordant FFR+/dPR− group (FFR ≤ 0.80 and dPR > 0.89), and discordant FFR−/dPR+ group (FFR > 0.80 and dPR ≤ 0.89).
Statistical analysis
Continuous variables are expressed as mean and standard deviation, while categorical variables are expressed as percentages. We measured the association between continuous variables using Pearson’s correlation coefficient. To determine differences in variables in the FFR/dPR concordance groups we used ANOVA (for continuous variables) and the chi-square test (for categorical variables). We used the chi-square test to assess how each variable impacted FFR−/dPR+ and FFR+/dPR− discrepancies, and a multiple logistic regression model with backward elimination to determine the factors impacting FFR−/dPR+ and FFR+/dPR− discrepancies. On univariate analysis, we included variables with P < .1 in the logistic regression analysis and excluded those with a total n < 10. The analysis was conducted using SPSS software (version 20.1) and R (version 4.0.4).
RESULTS
We included a total of 428 stenoses in 361 patients. Table 1 and table 2 show the patients’ baseline characteristics, clinical presentation, and procedural characteristics.
Table 1. Patients’ baseline characteristics
| N = 361 | |
|---|---|
| Age (years) | 65.80 ± 10.5 |
| Male sex | 76.9 |
| Hypertension | 63.3 |
| Diabetes mellitus | 31 |
| Hypercholesterolemia | 60.4 |
| Active/former smoker | 19.7/40.5 |
| Previous acute coronary syndrome | 30.5 |
| Atrial fibrillation | 14.7 |
| Heart failure/dysfunction | 15.4 |
| Peripheral artery disease | 10 |
| Valvular heart disease, previous bypass, stroke | < 6 |
Data are expressed as No. (%) mean ± standard deviation. | |
Table 2. Clinical presentation and procedural characteristics
| N = 361 | |
|---|---|
| Clinical presentation | N = 361 |
| Chest pain | 45.8 |
| Acute coronary syndrome | 23.1 |
| Unstable angina | 7.1 |
| Left ventricular dysfunction | 9.9 |
| Others | 14.2 |
| Procedural characteristics | |
| Baseline systolic blood pressure (mmHg) | 132 ± 24 |
| Systolic blood pressure during hyperemia (mmHg) | 125 ± 25 |
| Baseline heart rate (bpm) | 70 ± 12 |
| Heart rate during hyperemia (bpm) | 69 ± 15 |
| Reference luminal diameter (mm) | 3.09 ± 0.53 |
| Stenosis (%) | 54 ± 8 |
| Lesion length (mm) | 17.9 ± 12.2 |
| IV/intracoronary adenosine | 33/67 |
| Catheter size (5-Fr/6-Fr) | 17.5/81 |
| Drift ≥ ± 0.02 | 5.7 |
| dPR | 0.90 ± 0.08 |
| FFR | 0.83 ± 0.08 |
dPR, diastolic pressure ratio; FFR, fractional flow reserve. Data are expressed as No. (%) mean ± standard deviation. | |
Sixty-seven percent of the patients received intracoronary adenosine; the mean doses of intracoronary adenosine administered were 324 μg (standard deviation [SD] ± 152) via the right coronary artery and 442 μg (SD ± 234) via the left coronary artery.
The medians of dPR measurements were 0.90 and 0.90 (SD ± 0.08) for the first and second measurements, with positivity rates of 27.4% and 27.9%, respectively. For FFR, the medians were 0.83 and 0.83 (SD ± 0.08) for the first and second measurements, with positivity rates of 28.1% and 30%, respectively.
The most widely studied vessel was the left anterior descending coronary artery (63%), followed by the left circumflex (20%) and right coronary arteries (16%).
The left anterior descending coronary artery showed a higher positivity rate (dPR+, 35.3%; FFR, 34%) than the left circumflex (dPR, 11.9%; FFR, 20.5%) and right coronary arteries (dPR, 15.9%; FFR, 17.4%).
Diagnostic reproducibility was 95.8% for dPR, with a correlation coefficient between the 2 measurements (dPR1 and dPR2) of 0.974 (P < .0001) and a mean difference of 0.019 (max, 0.12; min, −0.17). For dPR values < 0.86 or > 0.92, diagnostic reproducibility was 99.6%, decreasing to 90.7% when values were ≥ 0.86 or ≤ 0.92. For FFR, diagnostic reproducibility was 94.9%, with a correlation coefficient (FFR1 and FFR2) of 0.942 (P < .0001) and a mean difference of 0.029 (max, 0.14; min, −0.18) (figure 1). Values < 0.77 or > 0.83 showed a diagnostic reproducibility of 98.6%, decreasing to 86.4% when these values were ≥ 0.77 or ≤ 0.83.
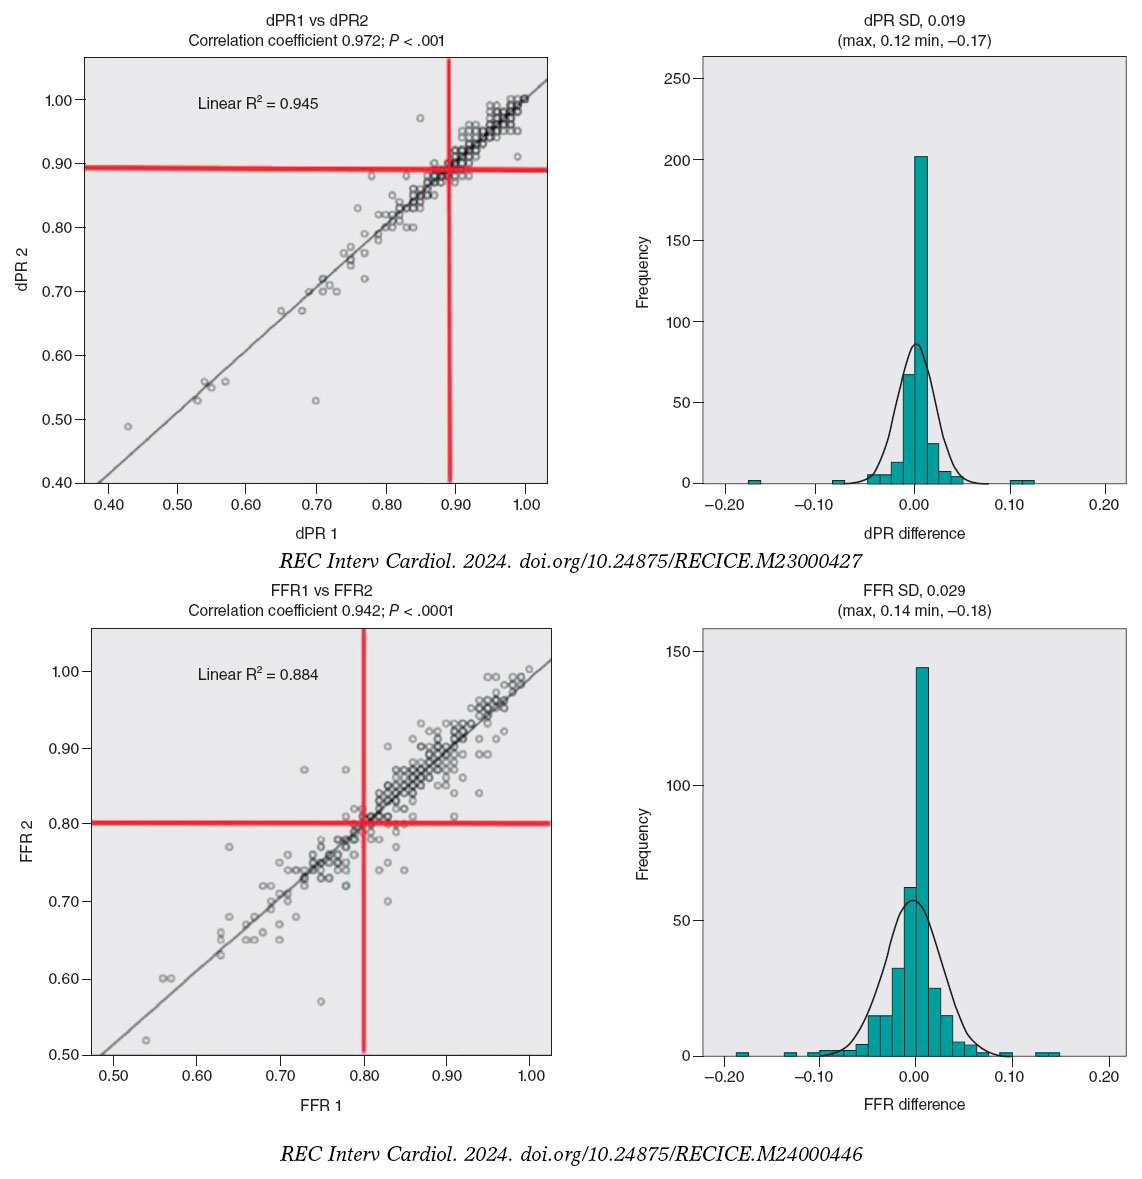
Figure 1. Correlation coefficient and histogram of the differences between the 2 dPR and FFR measurements. dPR, diastolic pressure ratio; FFR, fractional flow reserve; SD, standard deviation.
The diagnostic concordance (figure 2) between FFR and dPR was 82%, with a correlation coefficient of 0.721 (P < .0001), while diagnostic discordance was 18.2% (FFR+/dPR–, 8.2% and FFR–/dPR+, 10.0%). In the FFR+/dPR– discordant group, FFR was 0.76 ± 0.04 and dPR, 0.93 ± 0.03. In the FFR–/dPR+ discordant group, FFR was 0.84 ± 0.03 and dPR, 0.86 ± 0.03.
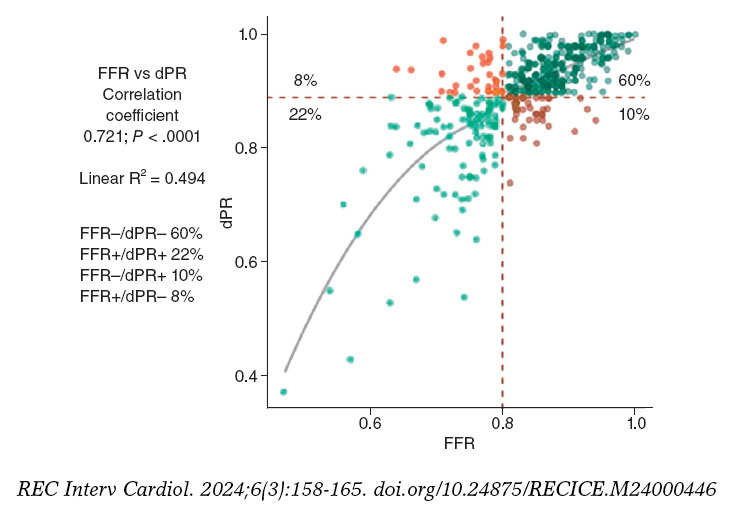
Figure 2. Distribution of lesions according to FFR and dPR, with the rate of concordant and discordant measurements. dPR, diastolic pressure ratio; FFR, fractional flow reserve.
Out of the 75 discordant results reported, the measurements at the cutoff value (7 stenoses with FFR 0.80 and 18 stenoses with dPR 0.89) showed a discordance rate of 72%, which decreased as it moved away from the cutoff value (figure 3).
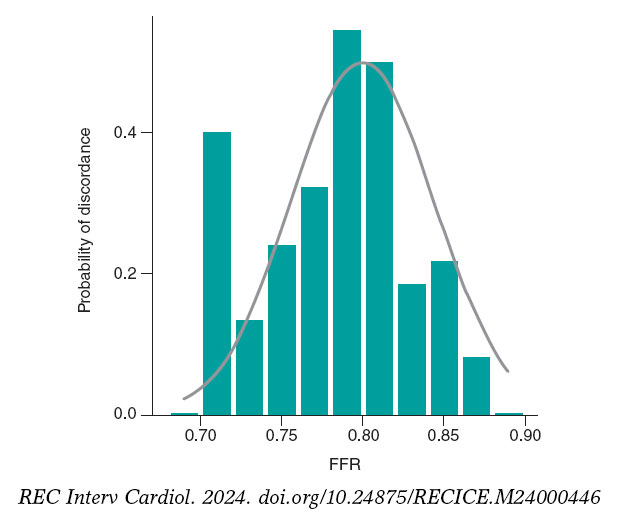
Figure 3. Probability of diagnostic discordance between FFR and dPR. The probability of discordance is close to 50% around the FFR cutoff point of 0.80 and decreases as it moves away from this point. Empirical model (bar chart) and model proposed by Petraco et al.11 (in grey). dPR, diastolic pressure ratio; FFR, fractional flow reserve.
Table 1 of the supplementary data illustrates the association between clinical and anatomical characteristics and the extent of agreement between FFR and dPR.
Out of all the variables analyzed in the multivariate analysis, hypertension (odds ratio [OR], 3.48, 95% confidence interval [95%CI], 1.01-11.98; P = .043) and intracoronary adenosine (OR, 7.04; 95%CI, 1.63-30.3; P = .001) were significantly associated with FFR–/dPR+ discordance. Age younger than 75 years (OR, 4.52; 95%CI, 1.03-20; P = .016) and percent diameter stenosis > 60% (OR, 6.69; 95%CI, 2.79-16; P < .001) were significantly associated with FFR+/dPR– discordance (table 3).
Table 3. Univariate analysis and multivariate logistic regression of variables associated with discordance
| Variables | FFR+/dPR− | FFR−/dPR+ | ||||||
|---|---|---|---|---|---|---|---|---|
| Univariate analysis | Multivariate logistic regression | Univariate analysis | Multivariate logistic regression | |||||
| OR (95%CI) | P | OR (95%CI) | P | OR (95%CI) | P | OR (95%CI) | P | |
| Age < 75 years | 9.5 vs 3.3 | .039 | 4.52 (1.03-20) | .016 | 7.1 vs 8.9 | .347 | ||
| Female sex | 5.7 vs 8.9 | .231 | 11.4 vs 6.2 | .079 | ||||
| Hypertension | 7.2 vs 10.4 | .178 | 10 vs 2.2 | .002 | 3.48 (1.01-11.98) | .043 | ||
| Diabetes mellitus | 7.3 vs 8.6 | .406 | 11.7 vs 5.3 | .018 | 2.11 (0.95-4.69) | .064 | ||
| Dyslipidemia | 7.5 vs 9.5 | .304 | 7.1 vs 6.7 | .525 | ||||
| HF/LV dysfunction | 4.4 vs 9.0 | .154 | 11.8 vs 6.7 | .118 | ||||
| Valvular heart disease | 7.7 vs 8.3 | .635 | 19.2 vs 6.8 | .037 | ||||
| Coronary calcification | 6.7 vs 8.6 | .387 | 5.3 vs 8 | .302 | ||||
| Moderate/severe tortuosity | 7.8 vs 8.3 | .516 | 10.6 vs 5.7 | .054 | ||||
| Left main coronary artery | 0 vs 7.9 | .612 | 50 vs 6.9 | .007 | ||||
| Left anterior descending coronary artery | 7.9 vs 7.6 | .531 | 9.4 vs 4.4 | .041 | ||||
| Right coronary artery | 10.8 vs 7.1 | .176 | 2.4 vs 8.8 | .029 | ||||
| Left circumflex artery | 4.3 vs 8.5 | .179 | 2.9 vs 8.4 | .081 | ||||
| RLD > 3 mm | 6.6 vs 13.3 | .049 | 7.5 vs 8 | .518 | ||||
| Length > 20 mm | 12.5 vs 5.4 | .010 | 7.8 vs 7.3 | .492 | ||||
| Stenosis > 60% | 16 vs 3 | < .001 | 6.69 (2.79-16) | < .001 | 5.8 vs 8.3 | .227 | ||
| Heart rate > 80 bpm | 8.4 vs 8 | .527 | 10.8 vs 6.8 | .155 | ||||
| Intracoronary adenosine | 7.4 vs 8.5 | .713 | 13 vs 3.8 | .004 | 7.04 (1.63-30.3) | .001 | ||
95%CI, 95% confidence interval; dPR, diastolic pressure ratio; FFR, fractional flow reserve; HF, heart failure; LV, left ventricle; OR, odds ratio; RLD, reference luminal diameter. Data are expresed in %. | ||||||||
The drift rate was 5.7%.
DISCUSSION
We present the results of the first study conducted with a FOSW capable of measuring the diagnostic variability of 2 consecutive determinations of nonhyperemic and hyperemic indices, as well as the diagnostic discordance between the 2 techniques.
Previous discordance studies between the 2 indices with PPSW revealed discordance rates ranging from 12% to 22%,12,13 largely depending on the proximity of the values to the cutoff point. In a study by Lee et al.,12 the mean iFR and FFR values were 0.95 ± 0.10 and 0.87 ± 0.11, respectively, with a discordance rate of 12%, while in a study by Warisawa et al.,13 the mean iFR and FFR values were 0.89 ± 0.05 and 0.80 ± 0.03, respectively, with a discordance rate of 22%. In our study, the discordance rate was 18.2%, with a mean dPR of 0.90 (SD ± 0.08) and a mean FFR of 0.83 (SD ± 0.08), which is a slightly lower discordance rate than that reported by previous studies on PPSW and mean iFR and FFR values close to the cutoff point, which may be indicative of the accuracy of measurements obtained with FOSW.
The main findings of this study were the excellent diagnostic reproducibility of the FOSW, the clinical and anatomical variables related to FFR/dPR discordance, and the low drift rate reported in the measurements.
Diagnostic reproducibility with the fiber-optic sensor wire
Diagnostic reproducibility with the FOSW was excellent, with a variation between 2 consecutive measurements < 0.02 for dPR and < 0.03 for FFR. This accuracy in measurement confers excellent diagnostic reproducibility. These data are better than those previously reported with PPSW.11
Clinical and anatomical variables associated with FFR/dPR discordance
For FFR+/dPR− discordance, in the multivariate analysis, only age younger than 75 years and percent diameter stenosis > 60% were significantly associated with FFR+/dPR− discordance. This discordance in participants younger than 75 years could be explained by a slower baseline flow and a greater coronary flow reserve in younger patients with preserved microvascular function.14,15 Although discordance due to a higher percent diameter stenosis has already been described in previous studies,15,16 such discordance requires a preserved coronary flow reserve.6 When arterial flow velocity significantly increases during hyperemia, the pressure gradient does so too, decreasing distal coronary pressure during hyperemia substantially compared with baseline values, resulting in a low FFR value.
For FFR−/dPR+ discordance, in the multivariate analysis, the associated variables were hypertension and the administration of intracoronary adenosine. Although hypertension has not been associated with FFR−/dPR+ discordance in previous studies, it is known that patients with hypertension and left ventricular hypertrophy have a reduced coronary flow reserve17 and a possible lack of vasodilatory response to adenosine due to an increased left ventricular end-diastolic pressure. These 2 factors could play a key role in the association between hypertension and FFR−/dPR+ discordance.
Although IV adenosine is the most widely studied route of administration to achieve maximum hyperemia, intracoronary adenosine at doses > 300 μg may be equally or more effective in achieving maximum hyperemia18 and with fewer adverse events.19 In our study, the FFR−/dPR+ discordance reported when intracoronary adenosine was used could be a result of a failure to achieve adequate hyperemia.
These variables related to discordance demonstrate that dPR and FFR measure different aspects of coronary circulation, which may be affected differently in distinct patients or myocardial territories, leading to discordant FFR values and nonhyperemic indices.20
Drift in the fiber-optic pressure wire
The incidence of drift in clinical studies of pressure wires is not well known, and the drift considered acceptable has varied over the years. Previously, FFR measurement was repeated when drift was > 5 mmHg,21 while in more recent studies, drift > 3 mmHg has been considered significant. When FFR is between 0.77 and 0.82, drift ≤ 3 mmHg can reclassify 18.7% of stenoses,22 and this reclassification may be higher when a nonhyperemic diastolic or whole-cycle index is used.23 In the CONTRAST trial analysis of the PPSW, the drift rate (Pd/Pa ± 0.03) was 17.5%,24 while a more recent study comparing drift between FOSW and PPSW revealed a significantly lower rate with the FOSW (4.8% vs 26.7%; P = .02).9 In our study, the drift rate was 5.7%, which is consistent with other studies on FOSW, and much lower than that reported with PPSW, facilitating the use of pressure wire in routine clinical practice.
Limitations
Our study has several limitations. Both the severity and length of coronary lesions were quantified by the operator’s visual estimation at the time of the procedure, and since this was a study without a core laboratory, we cannot rule out the possibility that some of the discrepancies found were due to technical problems in determining the indices. Since the study was based on our routine clinical practice, most patients received intracoronary adenosine, and the protocol did not specify the intracoronary infusion comprehensively, which may have resulted in the lower hyperemia reported in some patients.
Target lesion revascularization was based on dPR or FFR values according to the operators’ decision. Patient selection for pressure guidance evaluation was also left to the treating physician’s discretion, which may have resulted in biases. However, our intention was to study dPR and FFR indices under real-world conditions.
CONCLUSIONS
Although FFR and dPR measurements with FOSW have excellent reproducibility and a low incidence of drift, the discordance rate remains similar to that reported by previous studies with PPSW, and largely depends on the proximity of values to the cutoff point. Intracoronary adenosine and hypertension, which imply a lack of hyperemia or increased microvascular resistance, are associated with FFR−/dPR+ discordance. Age younger than 75 years and the severity of stenosis, which may be associated with a preserved coronary flow reserve, are related to FFR+/dPR− discordance.
FUNDING
This study received no funding.
ETHICAL CONSIDERATIONS
This study was approved by the Drugs Research Ethics Committee of the Basque Country (internal code PS 2019039) for its implementation. All patients received a patient information sheet about the study and signed an informed consent form before enrollment. The study took into consideration sex and gender variables before drafting this article.
DECLARATION ON THE USE OF ARTIFICIAL INTELLIGENCE
No artificial intelligence has been used.
AUTHORS’ CONTRIBUTIONS
M. Sádaba Sagredo drafted the protocol, included patients as the lead investigator of his center, and drafted the manuscript. A. Subinas Elorriaga and A. Quirós contributed to the statistical analysis and drafting of the manuscript. The remaining authors are lead investigators of the READI EPIC-14 trial in their respective centers and contributed to patient inclusion and article review.
CONFLICTS OF INTEREST
None declared.
WHAT IS KNOWN ABOUT THE TOPIC?
- Determination of fractional flow reserve (FFR) is a widely used technique to establish the functional significance of coronary stenoses. In recent years, resting indices have been developed to assess the functional significance of coronary stenoses without the need for adenosine administration. The optimal cutoff value—equivalent to 0.80 in FFR—has been established at 0.89. Despite its validation in clinical trials and endorsement in clinical practice guidelines, discordant results are obtained in up to 20% of the cases between the 2 techniques.
WHAT DOES THIS STUDY ADD?
- Studies on discordance between hyperemic and nonhyperemic indices are conducted with piezoelectric pressure sensor wires. Fiber-optic sensor wires are not sensitive to temperature or humidity changes, making measurements more reproducible and drift rates very low.
- No previous studies have compared the concordance between hyperemic and nonhyperemic indices with the use of a fiber-optic sensor wire. –Despite the low diagnostic variability of diastolic pressure ratio (dPR) and FFR (4.2% for dPR and 5.1% for FFR) in 2 consecutive measurements, and a similarly low drift rate (5.7%), the discrepancy between the 2 indices remains similar to that reported by previous studies (18.2%), indicating that discrepancies are more related to clinical and anatomical variables and proximity to the cutoff value than to the pressure wire used.
SUPPLEMENTARY DATA
Supplementary data associated with this article can be found in the online version available at https://doi.org/10.24875/ RECIC.M24000448.
ACKNOWLEDGEMENTS
We wish to thank M.ª Ángeles Carmona for her support in data collection and patient inclusion.
REFERENCES
1. Escaned J, Echavarría-Pinto M, Garcia-Garcia HM, et al. Prospective Assessment of the Diagnostic Accuracy of Instantaneous Wave-Free Ratio to Assess Coronary Stenosis Relevance:Results of ADVISE II International, Multicenter Study (ADenosine Vasodilator Independent Stenosis Evaluation II). JACC Cardiovasc Interv. 2015;8:824-833.
2. Davies JE, Sen S, Dehbi HM, et al. Use of the Instantaneous Wave-free Ratio or Fractional Flow Reserve in PCI. N Engl J Med. 2017;376:1824-1834.
3. Götberg M, Christiansen EH, Gudmundsdottir IJ, et al. Instantaneous Wave-free Ratio versus Fractional Flow Reserve to Guide PCI. N Engl J Med. 2017;376:1813-1823.
4. Neumann FJ, Sousa-Uva M, Ahlsson A, et al. 2018 ESC/EACTS Guidelines on myocardial revascularization. Eur Heart J. 2019;40:87-165.
5. Jeremias A, Maehara A, Généreux P, et al. Multicenter Core Laboratory Comparison of the Instantaneous Wave-Free Ratio and Resting Pd/Pa With Fractional Flow Reserve. The RESOLVE Study. J Am Coll Cardiol. 2014;63:1253-1261.
6. Cook CM, Jeremias A, Petraco R, et al. Fractional Flow Reserve/Instantaneous Wave-Free Ratio Discordance in Angiographically Intermediate Coronary Stenoses:An Analysis Using Doppler-Derived Coronary Flow Measurements. JACC Cardiovasc Interv. 2017;10:2514-2524.
7. Kobayashi Y, Johnson NP, Berry C, et al. The Influence of Lesion Location on the Diagnostic Accuracy of Adenosine-Free Coronary Pressure Wire Measurements. JACC Cardiovasc Interv. 2016;9:2390-2399.
8. Van't Veer M, Pijls N, Hennigan B, et al. Comparison of Different Diastolic Resting Indexes to iFR. Are They All Equal?J Am Coll Cardiol. 2017;70:3088-3096.
9. Haddad K, Potter B, Matteau A, et al. Assessing the Accuracy of a Second-Generation Optical Sensor Pressure Wire in a Wire-to-Wire Comparison (The ACCURACY Study). Cardiovasc Revasc Med. 2022;35:51-56.
10. Kern M. Comparing FFR Tools:New Wires and a Pressure Microcatheter. Cath Lab Digest. 2016;24(5).
11. Petraco R, Sen S, Echavarria-Pinto M, et al. Fractional Flow Reserve-Guided Revascularization. Practical Implications of a Diagnostic Gray Zone and Measurements Variability on Clinical Decisions. JACC Cardiovasc Interv. 2013;6:222-225.
12. Lee JM, Shin E-S, Nam C-W, et al. Discrepancy Between Fractional Flow Reserve and Instantaneous Wave-free Ratio:Clinical and Angiographic Characteristics. Int J Cardiol. 2017;245:63-68.
13. Warisawa T, Cook C, Howard JP, et al. Physiological Pattern of Disease Assessed by Pressure-Wire Pullback Has an Influence on Fractional Flow Reserve/Instantaneous Wave-Free Ratio Discordance. Insights From the Multicenter AJIP Registry. Circ Cardiovasc Interv. 2019;12:e007494.
14. Lim HS, Pim AL, De Bruyne B, et al. The impact of age on fractional flow reserve-guided percutaneous coronary intervention:A FAME (Fractional Flow Reserve versus Angiography for Multivessel Evaluation) trial substudy. Int J Cardiol. 2014;177:66-70.
15. Dérimay F, Johnson NP, Zimmermann FM, et al. Predictive factors of discordance between the instantaneous wave-free ratio and fractional flow reserve. Catheter Cardiovasc Interv. 2019;94:356-363.
16. Wienemann H, Meyer A, Mauri V, et al. Comparison of Resting Full-Cycle Ratio and Fractional Flow Reserve in a German Real-World Cohort. Front Cardiovasc Med. 2021;8:744181.
17. Schäfer S, Kelm, Mingers S, Strauer BE. Left ventricular remodeling impairs coronary flow reserve in hypertensive patients. J Hypertens. 2002;20:1431-1437.
18. Lopez-Palop R, Carrillo P, Frutos A, et al. Comparison of effectiveness of high-dose intracoronary adenosine versus intravenous administration on the assessment of fractional flow reserve in patients with coronary heart disease. Am J Cardiol. 2013;111:1277-1283.
19. Abo-Aly M, Lolay G, Adams C, et al. Comparison of Intracoronary versus Intravenous Adenosine-induced Maximal Hyperemia for Fractional Flow Reserve Measurement:A Systematic Review and Meta-analysis. Catheter Cardiovasc Interv. 2019;94:714-721.
20. Nijjer SS, De Waard GA, Sen S, et al. Coronary pressure and flow relationships in humans:phasic analysis of normal and pathological vessels and the implications for stenosis assessment:a report from the Iberian–Dutch–English (IDEAL) collaborators. Eur Heart J. 2016;37:2069-2080.
21. Vranckx P, Cutlip DE, McFadden EP, Kern MJ, Mehran R, Muller O. Coronary Pressure–Derived Fractional Flow Reserve Measurements. Recommendations for Standardization, Recording, and Reporting as a Core Laboratory Technique. Proposals for Integration in Clinical Trials. Circ Cardiovasc Interv. 2012;5:312-317.
22. Wakasa N, Kuromochi T, Mihashi N, et al. Impact of Pressure Signal Drift on Fractional Flow Reserve-Based Decision-Making for Patients With Intermediate Coronary Artery Stenosis. Circ J. 2016;80:1812-1819.
23. Cook C, Ahmad Y, Shun-Shin MJ, et al. Quantification of the Effect of Pressure Wire Drift on the Diagnostic Performance of Fractional Flow Reserve, Instantaneous Wave-Free Ratio, and Whole-Cycle Pd/Pa. Circ Cardiovasc Interv. 2016;9:e002988.
24. Matsumura M, Johnson N, Fearon WF, et al. Accuracy of Fractional Flow Reserve Measurements in Clinical Practice:Observations From a Core Laboratory Analysis. JACC Cardiovasc Interv. 2017;10:1392-1401.


