
ABSTRACT
Introduction and objectives: Former studies have associated the severity of calcified plaques (CP) on the invasive coronary angiography (ICA) with a limited number of optical coherence tomography (OCT) measurements. The objective of this study was to describe the correlation between an extended and comprehensive set of OCT measurements and the severity of calcifications as seen on the ICA.
Methods: We retrospectively studied 75 patients (75 lesions) who underwent ICA and, concurrently, OCT imaging at a single institution. The OCT was performed before the percutaneous coronary intervention and after the administration of intracoronary nitroglycerine. The coronary artery calcium was scored using a three-tier classification system on the ICA. Maximum calcium angle, area, maximum thickness, length of calcium, and calcium depth were assessed on the OCT.
Results: The ICA detected fewer CP lesions compared to the OCT (N = 69; 92%), all cases of positive ICA were detected by the OCT (N = 30; 100%). The OCT did not find any positive lesions in negative angiographic lesions (N = 6; 100%). The sensitivity of the ICA was 43.5% (95%CI, 0.32-0.56) and its specificity, 100% (95%CI, 0.52-1.0). In most cases, as calcium angle, thickness, and area increased on the OCT so did the calcium severity of the lesions on the angiography.
Conclusions: Compared to the OCT, the ICA has a low sensitivity and a high specificity in the detection of calcified plaques. As calcium angle, thickness, area, and length increased on the OCT so did the number of angio-defined lesions of severe CP.
Keywords: Tomography. Optical coherence tomography. Invasive coronary angiography. Percutaneous coronary intervention. Calcification.
RESUMEN
Introducción y objetivos: Estudios previos han asociado la gravedad de la calcificación de las lesiones coronarias evaluadas con angiografía coronaria invasiva (ACI) con un número limitado de medidas obtenidas con tomografía de coherencia óptica (OCT). El objetivo de este estudio es analizar la correlación de una amplia y exhaustiva serie de medidas de OCT con la gravedad de la calcificación estimada por ACI.
Métodos: Se estudiaron retrospectivamente 75 pacientes (75 lesiones) de un único centro a quienes se realizaron simultáneamente ACI y OCT. La OCT se llevó a cabo tras la administración de nitroglicerina intracoronaria antes del intervencionismo coronario. En la ACI, la calcificación coronaria se valoró utilizando un sistema de clasificación en tres grados. Con OCT se evaluaron el máximo ángulo, el área, el grosor máximo, la longitud y la profundidad del calcio.
Resultados: La ACI detectó menos lesiones calcificadas que la OCT (n = 69; 92%) y todos los casos detectados por ACI fueron identificados con OCT (n = 30; 100%). La OCT no encontró calcio en ninguna de las lesiones sin calcio en la ACI (n = 6; 100%). La sensibilidad de la ACI fue del 43,5%, (IC95%, 0,32-0,56) y la especificidad del 100% (IC95%, 0,52-1,0). A medida que se incrementaron el ángulo, el grosor y el área del calcio por OCT también aumentó la gravedad del calcio determinada por ACI en la mayoría de los casos.
Conclusiones: La ACI tiene una baja sensibilidad, pero una alta especificidad, para la detección de lesiones calcificadas en comparación con la OCT. Al incrementarse el ángulo, el grosor, el área y la longitud del calcio en la OCT aumenta el número de lesiones con calcificación grave en la ACI.
Palabras clave: Tomografia. Coherencia optica. Angiografia coronaria invasiva. Intervencion coronaria percutanea. Calcificacion.
Abbreviations CP: calcified plaque. OCT: optical coherence tomography. ICA: invasive coronary angiography.
INTRODUCTION
Coronary artery disease is very prevalent in the United States and is associated with high cardiovascular mortality rates.1 The management of advanced coronary artery disease (eg, calcified lesions) is often the percutaneous coronary intervention, but the use of the PCI alone in calcified plaques (CP) is associated with poor procedural outcomes.2-5 This is mainly due to the lack of information on the spread of calcification and its appropriate management before stenting. Therefore, intravascular imaging modalities are necessary for the characterization of calcium inside the vessel and better guide the interventional cardiologist.6-9
The optical coherence tomography (OCT) is a high-resolution cross-sectional imaging modality with an unparalleled axial resolution of around 4-20 microns.10 The OCT allows more accurate measurements of the CP over other invasive imaging modalities like the invasive coronary angiography (ICA) and the intravascular ultrasound (IVUS).11
Prior studies have associated the severity of the CP on the ICA with a limited number of measurements on the OCT.6,12-14 Our study aimed to further describe the correlation between an extended and comprehensive set of OCT measurements and the severity of calcification as seen on the ICA.
METHODS
Study population
We retrospectively studied 75 patients who underwent ICA and concurrently had OCT imaging acquired at the St. Francis Hospital, Roslyn, NY, United States, from November 2018 through April 2019. A total of 109 lesions were identified in these patients on the ICA. An OCT plus an ICA analysis were performed on 75 of these lesions deemed primary lesions while 34 lesions were excluded from the analysis (no OCT available). All primary lesions were lesions seen on the OCT images, not on the target lesion that received the stent during the procedure. No severely calcified plaques that could not be catheterized were excluded. All the lesions excluded were secondary or tertiary lesions that were deemed non-primary based on the lower calcification burden. No lesions required preparation or ablation before the OCT imaging. All the calcified spots in the population were not thick enough so as to cast a shadow. An institutional review board waiver was obtained because of the retrospective nature of this study. Patient consent was obtained for both the ICA and the OCT.
Optical coherence tomography acquisition
The OCT was performed before the percutaneous coronary intervention and after the administration of intracoronary nitroglycerine (100 µg-200 µg) using the frequency-domain OCT ILUMIEN OPTIS system (Abbott Vascular, United States) and a 2.7-Fr OCT imaging catheter (C7 Dragonfly, Dragonfly Duo or Dragonfly OPTIS; Abbott Vascular, United States). An OCT catheter was advanced distally to the lesion. Also, contrast media was injected manually through the guiding catheter with automatic pullback at a rate of 20 mm/sec for an average pullback distance of 75 mm ± 12.2 mm.
Imaging definition and analysis
The ICA and the OCT imaging were co-registered with respect to each other based on each patients’ anatomical landmarks. Afterwards, the co-registered ICA and OCT imaging had all identifiers removed. Both the ICA and the OCT measurements were assessed independently by two experienced angiography evaluators who were blind to the patients’ information except for the data on the anatomical location of the lesion on the ICA that was assessed on 2 different projections to secure increased accuracy when looking at the vessel. The evaluators then scored the degree of calcium based on the three-tier classification system: minimal or no calcification; calcium covering ≤ 50% of the vessel circumference was classified as “moderate calcification”; calcium covering between 50% and 100% of the vessel circumference was classified as “severe calcification” according to Mintz et al. classification.9 In case of discrepancy between the evaluators, a third evaluator blind to the information of both the patient and the independent reviewers’ assessment was invited to grade the degree of calcification.
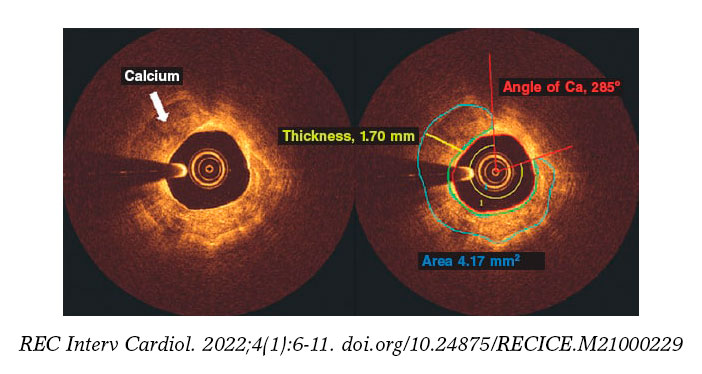
The OCT calcium analysis was performed in the pre-percutaneous coronary intervention iFR-pullbacks. All the OCT analyses of the CP were performed using the QIVUS 3.1 validation utility tool (Medis Medical Imaging, The Netherlands) based on a standardized operating procedure at the core lab (MedStar Cardiovascular Research Network). The CP was analyzed on the area of maximum severity and defined by heterogenous areas of low signal attenuation and sharply demarcated borders. We assessed all pullbacks at lesion site level: the maximum calcium angle, maximum thickness, and length of calcium (number of frames with calcium). The angle of calcium was determined using the center of the lumen as the vertex (figure 1, red rays) as it extended from one clearly delineated border of the calcium plaque to the other. Automatic software detection was used to identify the fibrous cap overlying the calcium area and the maximum and minimum depths of calcium (figure 1, area in green). We tracked down the area of calcium determined by border delineation of the heterogenous calcium plaque. Calcium thickness (figure 1, yellow line) was analyzed on the slice with the maximum angle (figure 1). The length of calcium was derived by the total number of calcium-containing slices and then multiplied by the frame interval.
Figure 1. Optical coherence tomography frames showing a calcified plaque. The angle of calcium was determined using the center of the lumen as the vertex (red rays) and extending from one clearly delineated border of the calcium plaque to the other. Automatic software detection was used to identify the cap of the calcium plaque and the maximum and minimum depths of calcium (area in green). Calcium thickness (yellow line) was analyzed on the slice with the maximum angle after tracking down the area of calcium determined by the delineated borders of the heterogenous calcium plaque. Ca, calcium.
Intra- and inter-rater observer reproducibility
The intra-rater variability of the ICA and the OCT imaging analysis was assessed by evaluating 24 randomly selected images of primary lesions deemed inexistent/mild, moderate, and severe by 2 independent evaluators on both the ICA and the OCT. All OCT measurements including angle, thickness, length, and area were also measured. The same 2 evaluators analyzed the same 24 ICA and OCT images 4 weeks after the early evaluation.
The inter-rater variability of the ICA and the OCT imaging analysis was assessed by evaluating 50 randomly selected images of primary lesions deemed inexistent/mild, moderate, and severe by the same 2 independent evaluators on both the ICA and the OCT. All OCT measurements including angle, thickness, length, and area were also measured. The independent evaluator analyses were then compared. Both the inter and Intra-rater reproducibility were analyzed using Cohen’s kappa coefficient.
Statistical method
The comparison of all categorical variables (presented as counts and percentages) was performed using the chi-square test or Fisher’s exact test. Continuous data were compared used the Student t test. Continuous data were expressed as mean ± standard deviation for normally distributed variables or as median (interquartile range) for non-normally distributed variables. The sensitivity and specificity of the ICA with respect to the OCT were determined using standard 2 x 2 tables. Logistic regression determined the relationship between severity as seen on the angiography and the OCT measurements. The receiver operating characteristic (ROC) analysis established the optimal cut-off values using the area under the curve and Youden’s index.
RESULTS
Intra- and inter-rater observer reproducibility analysis
There was a 96% agreement (23/24; k = 0.92) on the intra-rater agreement between the analysts. This was indicative of an almost perfect inter-analysis agreement. There was only 1 case of disagreement between moderate calcification vs inexistent/mild calcification.
There was a 94% agreement (47/50; k = 0.72) on the inter-rater agreement between the analysts. This was indicative of substantial inter-rater agreement. There was disagreement between the analysts in 2 cases of moderate vs inexistent/mild calcification and in 1 case of moderate vs severe calcification.
Population
The baseline clinical characteristics of our patients are shown on table 1. Patient population was predominantly male with ages from 56.3 to 75.5. Most patients presented with unstable angina. Comorbidities were present in most of the patients being hypertension the most prevalent of all closely followed by hyperlipidemia. Smokers comprised over half of the patient population. The most common vessel imaged on the OCT was the left anterior descending coronary artery.
Table 1. Patient demographics and angiographic findings
| N = 75 | |
|---|---|
| Age, years | 65.9 ± 9.6 |
| Male | 55 (73.3) |
| Body height, cm | 171.6 ± 11.6 |
| Body weight, kg | 92.4 ± 20.3 |
| Creatinine levels, mg/dL | 1.12 ± 0.95 |
| Diabetes | 28 (37.33) |
| Hypertension | 59 (78.67) |
| Hyperlipidemia | 57 (76) |
| Smoker | 40 (53.33) |
| Hemodialysis | 2 (2.67) |
| Peripheral artery disease | 4 (5.33) |
| Previous myocardial infarction | 11 (14.67) |
| Previous coronary artery bypass graft | 4 (5.33) |
| Clinical presentation | |
| ST-elevation myocardial infarction | 0 (0) |
| Non-ST-elevation myocardial infarction | 7 (9.33) |
| Unstable angina | 43 (57.33) |
| Silent ischemia | 4 (5.33) |
| Angiographic findings | |
| Percutaneous coronary intervention | 61 (81.33) |
| Femoral access site | 63 (84) |
| Catheter Size, French | 6 |
| Target vessel | |
| Left main coronary artery | 1 (1.33) |
| Left anterior descending coronary artery/Diagonal branches | 61 (81.33) |
| Left circumflex artery/Ramus intermedius branch/Obtuse marginal | 10 (13.33) |
| Right circumflex artery/Posterior descending artery | 7 (9.59) |
| Lesion location | |
| Proximal | 40 (57.14) |
| Mid | 26 (37.14) |
| Distal | 4 (5.71) |
| Lesion and stent parameters | |
| Lesion length, mm | 25.84 ± 13.47 |
| Lesion stenosis | 74.74 ± 15.27 |
| Stent diameter, mm | 3.11 ± 0.53 |
| Stent length, mm | 24.62 ± 8.84 |
| Pullback distance, mm | 75 ± 12.2 |
Data are expressed as no. (%) or mean ± standard deviation. | |
Angiographic severity and optical coherence tomography parameters
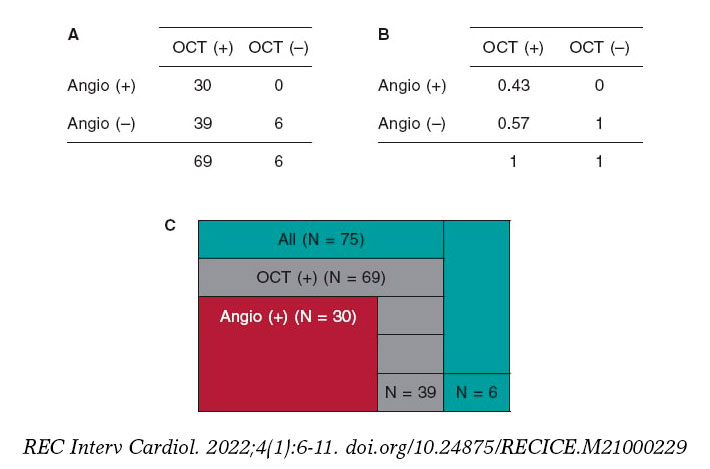
We examined a total of 75 lesions. The detection of CP lesions on the angiography in relation to the OCT is shown on figure 2. The angiography detected fewer CP lesions compared to the OCT that detected positive lesions (n = 69; 92%). All cases of positive angiography were detected by the OCT (n = 30; 100%). The OCT did not find any positive lesions in negative angiographic lesions (n = 6; 100%). A total of 43% of the lesions were both OCT positive and ICA positive. The ICA sensitivity was 95%CI, 0.32-0.56, and the ICA specificity, 95%CI, 0.52-1.0.
Figure 2. Calcified plaques lesions as seen on the angiography in relation to the OCT. A: OCT positive and negative values on the x-axis, and angio positive and negative values on the y-axis. The 4 x 4 table shows the correlation between the OCT and the angio measurements by primary lesion number. B: OCT positive and negative values on the x-axis, and angio positive and negative values on the y-axis. The 4 x 4 table shows the correlation between the OCT and the angio measurements by primary lesion percentage. C: total primary lesion numbers (in green color); the partition on the green color represents the primary lesions not found on the OCT or the angio. All OCT positive primary lesions are represented (in gray color); the partition on the gray color represents the OCT primary lesions not found on the angio. All angio positive lesions are shown (in red color); these lesions were all detected by the OCT. Angio, angiography; OCT, optical coherence tomography.
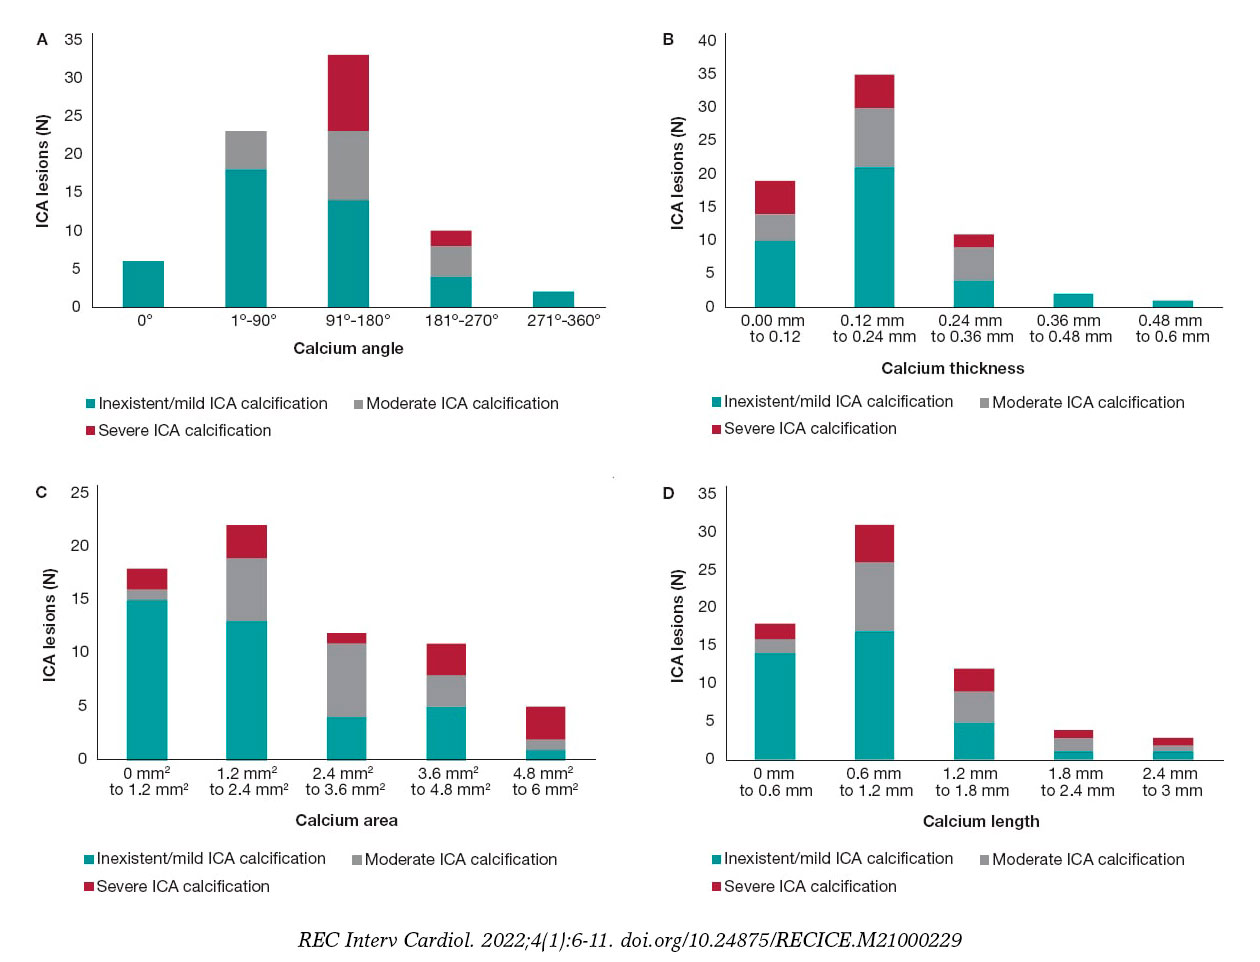
In most of cases, as the calcium angle (figure 3A), thickness (figure 3B), area (figure 3C), and length (figure 3D) increased on the OCT so did the calcium severity of the lesions on the angiography. The association between calcium severity as seen on the angiography and calcium length as seen on the OCT is shown on figure 3D. On the OCT, the severity of CP lesions run parallel to the increasing length seen on OCT.
Figure 3. A: angiographic lesions graded by severity inside the OCT angle measurements. All values are expressed in frequencies. Angles are in ranges of equal proportions based on the degrees seen. The most severe OCT lesions were found in the 91º-180° range followed by the 181º-270° OCT angle measurement. No severe CP lesions were found in the 0°, 1º-90° OCT angle measurements. B: angiographic lesions graded by severity inside the OCT thickness. All lesions are expressed as frequencies. The OCT thickness is expressed in mm and distributed in ranges that go from minimum to maximum values. The highest degree of angiographic calcium score-severe CP-was equally found in 0 mm-0.12 mm, and 0.12 mm-0.24 mm thicknesses on the OCT. C: angiographic lesions graded by severity inside the OCT area. All lesions are expressed as frequencies. The OCT area is expressed in mm2 and distributed in ranges that go from minimum to maximum values. The highest degree of angiographic calcium score-severe CP-was found from 4.8 mm2 to 6 mm2. D: angiographic lesions graded by severity inside the OCT length. All lesions are expressed as frequencies. The OCT length is expressed in mm and distributed in ranges that go from minimum to maximum values. The highest degree of angiographic calcium score- severe CP- was detected from 0.6 mm to 1.2 mm. CP, calcified plaques; ICA, interventional coronary angiography; OCT, optical coherence tomography.
DISCUSSION
The main findings of our study are: a) compared to the OCT, the ICA has a low sensitivity and a high specificity for the detection of calcium; b) as calcium angle, thickness, area, and length increased on the OCT so did the number of angio-defined severe CP lesions.
The ICA provides 2D real-time imaging with in-vivo characteristics of the lumen profile.15 Conversely, the invasive 3D-OCT imaging modality has the highest resolution to characterize variations in the composition of the plaque.11,16 The ICA detection of angiographic lesions has been used for decades. However, studies have shown that the ICA capabilities to detect calcified plaques in the arterial wall are poor.6,11,17 Some studies have compared the ICA characterization and quantification of plaque to the coronary computed tomography angiogram and the intravascular ultrasound, but few have looked into ICA plaque characterization and quantification with the OCT.6 Our study examined the sensitivity and specificity of ICA compared to the OCT. We examined 75 lesions and found that ICA sensitivity and specificity were 32%-56%, and 52%-100% with a 95%CI, respectively. Sensitivity was lower compared to former studies that showed a 50.9% sensitivity and a 95.1% specificity.6 The sensitivity of ICA is low because it only provides a 2D projection of the lesion and its resolution compared to the OCT is worse.18,19
The OCT detected all CPs present on the ICA (n = 30) and, also, lesions that were not present on the ICA (n = 39). On the angiography, the presence of CP is indicative that calcification has large CP characteristics on the OCT (eg, angle, thickness, and area). Our study concluded that severe calcifications on the ICA are seen with higher calcium angles on the OCT as the study conducted by Wang et al proved.6 The clinical implication of this is that when the ICA detects a calcified lesion, whether moderate or severe, the clinician can be sure that this calcification is, actually, present. The OCT would be the logical next step for a better characterization of the CP. Determining the morphology of the calcified lesion (eg, superficial, deep, or nodular) on the OCT allows selecting the optimal lesion preparation strategy. Also, the OCT detected calcifications that the ICA simply could not find, indicative that the ICA alone is not reliable to detect CPs. Therefore, with suspected lesions, the OCT should be the next step for a comprehensive assessment of these lesions.
The OCT measurements of a calcified lesion thickness, length, and area are unique to this technology because the OCT is the only invasive imaging modality capable of measuring these values.6 Thicknesses > 0.5 mm are associated with stent underexpansion.7,20 We did not explore this in our population since not all lesions received percutaneous coronary intervention. We did expand, however, the OCT analysis to include the depth, and area of calcium on the OCT. We found that as the area increased on the OCT so did the number of severe lesions on the ICA. We found that most severe CP lesions were in the 4.8-6 mm2 range. Perhaps, calcium areas > 5 mm2 may be the fourth “5” in the OCT-based “rule of five” that identifies the CP features associated with poor stent expansion.7
Study limitations
This was a retrospective observational study with its inherent limitations. The sample size was relatively small.
CONCLUSIONS
Invasive coronary angiography has a low sensitivity and a high specificity for the detection of calcified plaques compared to the OCT. As calcium angle, thickness, area, and length increased on the OCT so did number of angio-defined severe CP lesions.
FUNDING
None.
AUTHORS’ CONTRIBUTIONS
C. McGuire: study idea, data mining, manuscript draft, and analysis; E. Schlofmitz: study idea, data mining, critical review of the manuscript; G. D. Melaku, K. O. Kuku, and Y. Kahsay: data mining, critical review of the manuscript; R. Schlofmitz, and A. Jeremias: writing, critical review of the manuscript; H. M. Garcia-Garcia: study idea, data analysis, data mining, preparation, and critical review of the manuscript.
CONFLICTS OF INTEREST
H.M. Garcia-Garcia declared having received institutional grant support from Biotronik, Boston Scientific, Medtronic, Abbott, Neovasc, Shockwave, Phillips, and Corflow. The remaining authors declared no conflicts of interest.
WHAT IS KNOWN ABOUT THE TOPIC?
- Percutaneous coronary interventions rely on angiography to inform most of the clinical decisions on lesion preparation; however, the extent of calcium is poorly assessed on the angiography.
- The relation between the ICA and the OCT regarding the severity of CP was examined using thickness and angle measurements on the OCT.
- No examination has been conducted of all OCT measurements and their relation to the severity of CP as seen on the ICA.
WHAT DOES THIS STUDY ADD?
- Compared to the OCT, the ICA has a low sensitivity but a high specificity to detect severely calcified plaques.
- As calcium increased on the OCT measurements regarding area, length, thickness, and angle so did the number of angio-defined severe CP lesions, which is indicative that all OCT measurements can be used to detect severely calcified lesions.
- The OCT offers a feasible alternative to the angiography regarding calcium assessment; it extends calcium characterization by providing detailed information to shed light on the use of dedicated calcium debulking therapies for lesion preparation.
REFERENCES
1. Miao Benjamin, Hernandez Adrian V., Alberts Mark J., Mangiafico Nicholas, Roman Yuani M., Coleman Craig I. Incidence and Predictors of Major Adverse Cardiovascular Events in patients With Established Atherosclerotic Disease or Multiple Risk Factors. J Am Heart Assoc. 2020;9:e014402.
2. Guedeney P, Claessen BE, Mehran R, et al. Coronary Calcification and Long-Term Outcomes According to Drug-Eluting Stent Generation. JACC Cardiovasc Interv. 2020;13:1417-1428.
3. Costa JR, Sousa A, Moreira AC, et al. Incidence and Predictors of Very Late (?4 Years) Major Cardiac Adverse Events in the DESIRE (Drug-Eluting Stents in the Real World)-Late Registry. JACC Cardiovasc Interv. 2010;3:12-18.
4. Conway C, McGarry JP, Edelman ER, McHugh PE. Numerical Simulation of Stent Angioplasty with Predilation: An Investigation into Lesion Constitutive Representation and Calcification Influence. Ann Biomed Eng. 2017;45:2244-2252.
5. Waters DD, Azar RR. The Curse of Target Lesion Calcification. J Am Coll Cardiol. 2014;63:1855-1856.
6. Wang X, Matsumura M, Mintz GS, et al. In Vivo Calcium Detection by Comparing Optical Coherence Tomography, Intravascular Ultrasound, and Angiography. JACC Cardiovasc Imaging. 2017;10:869-879.
7. Fujino A, Mintz G, Matsumura M, et al. TCT-28. A New Optical Coherence Tomography-Based Calcium Scoring System to Predict Stent Underexpansion. J Am Coll Cardiol. 2017;70 (18, Supplement):B12-B13.
8. Lee T, Mintz GS, Matsumura M, et al. Prevalence, Predictors, and Clinical Presentation of a Calcified Nodule as Assessed by Optical Coherence Tomography. JACC Cardiovasc Imaging. 2017;10:883-891.
9. Mintz GS, Popma JJ, Pichard AD, et al. Patterns of calcification in coronary artery disease. A statistical analysis of intravascular ultrasound and coronary angiography in 1155 lesions. Circulation. 1995;91:1959-1965.
10. Brezinski ME, Tearney GJ, Bouma BE, et al. Imaging of coronary artery microstructure (in vitro) with optical coherence tomography. Am J Cardiol. 1996;77:92-93.
11. Wang Ying, Osborne Michael T., Tung Brian, Li Ming, Li Yaming. Imaging Cardiovascular Calcification. J Am Heart Assoc. 2018;7:e008564.
12. Oosterveer TTM, van der Meer SM, Scherptong RWC, Jukema JW. Optical Coherence Tomography: Current Applications for the Assessment of Coronary Artery Disease and Guidance of Percutaneous Coronary Interventions. Cardiol Ther. 2020;9:307-321.
13. Gharaibeh Y, Prabhu DS, Kolluru C, et al. Coronary calcification segmentation in intravascular OCT images using deep learning: application to calcification scoring. J Med Imaging (Bellingham). 2019;6:045002.
14. Kume T, Akasaka T, Kawamoto T, et al. Assessment of Coronary Intima - Me-dia Thickness by Optical Coherence Tomography. Circ J. 2005;69:903-907.
15. Ryan Thomas J. The Coronary Angiogram and Its Seminal Contributions to Cardiovascular Medicine Over Five Decades. Circulation. 2002;106:752-756.
16. Kubo T, Imanishi T, Takarada S, et al. Assessment of culprit lesion morphology in acute myocardial infarction: ability of optical coherence tomography compared with intravascular ultrasound and coronary angioscopy. J Am Coll Cardiol. 2007;50:933-939.
17. Tuzcu EM, Berkalp B, De Franco AC, et al. The dilemma of diagnosing coronary calcification: Angiography versus intravascular ultrasound. J Am Coll Cardiol. 1996;27:832-838.
18. Lee CH, Hur S-H. Optimization of Percutaneous Coronary Intervention Using Optical Coherence Tomography. Korean Circ J. 2019;49:771-793.
19. Park S-J, Kang S-J, Ahn J-M, et al. Visual-functional mismatch between coronary angiography and fractional flow reserve. JACC Cardiovasc Interv. 2012;5:1029-1036.
20. Fujino A, Mintz GS, Lee T, et al. Predictors of Calcium Fracture Derived From Balloon Angioplasty and its Effect on Stent Expansion Assessed by Optical Coherence Tomography. JACC Cardiovasc Interv. 2018;11:1015-1017.
* Corresponding author: Division of Interventional Cardiology, MedStar Washington Hospital Center, 100 Irving St, NW Washington D.C. 20010, United States.
E-mail addresses: hector.m.garciagarcia@medstar.net; hect2701@gmail.com (H.M. Garcia-Garcia)


