
ABSTRACT
Initially, percutaneous mitral clip emerges as an alternative to surgery in patients with severe mitral regurgitation (MR) and high surgical risk. Nonetheless, it is now also considered a first-line treatment in patients with left ventricular ejection fractions somewhere between 20% and 50%, end-systolic diameters < 70 mm, and pulmonary systolic pressures < 70 mmHg. Successful results depend on reducing the severity of MR. The common parameters used to evaluate native MR have not been properly validated in this context. Therefore, the parameters that should be used to quantify residual MR during intraprocedural transesophageal echocardiography are still under discussion. There is scarce evidence and no validation studies. Although these have limitations, color Doppler echocardiography, proximal isovelocity surface area (PISA) and its derived area, continuous-wave Doppler signal, transmitral flow, and regurgitant flow are not accurate parameters to quantify residual MR due to clip artifacts. On the other hand, the width of the vena contracta, the 3D-vena contracta area, and pulmonary venous flow are associated with a satisfactory approach. Using a comprehensive method is the most practical thing to do.
Keywords: Mitral clip. Mitral regurgitation. Intraoperative transesophageal echocardiography. Mitral regurgitation assessment.
RESUMEN
Inicialmente el clip mitral surge como alternativa a la cirugía en pacientes con insuficiencia mitral (IM) grave y alto riesgo quirúrgico. Sin embargo, recientemente se ha posicionado también como tratamiento de primera línea en pacientes con fracción de eyección del ventrículo izquierdo del 20-50%, con diámetro telesistólico ventricular izquierdo < 70 mm y presión sistólica pulmonar < 70 mmHg. Su éxito depende de la disminución de la gravedad de la IM. Los parámetros usados para cuantificar la IM nativa no se han validado de manera adecuada en presencia de clip, por lo que resulta controvertido establecer cuál es el método de elección para valorar la IM residual en la ecocardiografía transesofágica intraprocedimiento. La escasa evidencia disponible carece de estudios de validación. Pese a sus limitaciones, parece que el Doppler color, el área de superficie de isovelocidad proximal y su área derivada, la señal del Doppler continuo, el flujo transmitral y el volumen regurgitante no son fiables debido a los artefactos producidos por el clip. La combinación de la anchura de la vena contracta, el área de la vena contracta medida por ecografía tridimensional y el patrón del flujo en las venas pulmonares parece arrojar resultados satisfactorios. La evaluación integral con varios parámetros es lo más completo.
Palabras clave: Clip mitral. Insuficiencia mitral. Ecocardiografía transesofágica intraprocedimiento. Cuantificación de la insuficiencia mitral.
Abbreviations IM: insuficiencia mitral. PISA: área de isovelocidad proximal. ETE: ecocardiografía transesofágica.
INTRODUCTION
Percutaneous mitral repair with clip initially started as a therapeutic alternative to mitral valve surgery in cases of unacceptable surgical risk and severe, symptomatic mitral regurgitation (MR).1,2 Based on the latest scientific evidence available, the European Society of Cardiology and the American Heart Association consider the clip as the first-line therapy for patients with severe, symptomatic MR despite the optimal medical therapy, left ventricular ejection fraction between 20% and 50%, left ventricular end-diastolic diameter < 70 mm, and pulmonary artery systolic pressure < 70 mmHg.3,4 The procedure is based on the central approximation of the free edges of the leaflets to create a double orifice on both sides of the device.5
Quantifying MR on the native valve is challenging in routine clinical practice due to the valve morphology (oval-shaped, 2 commissures in different planes, divided into 3 anterior and 3 posterior scallops), due to the limitations of two- and three-dimensional (2D and 3D) transthoracic and transesophageal echocardiography with respect to the orientation of the transducer and the plane slices, and because it is an operator-dependent technique. If the valve morphology changes after clip implantation, quantifying MR is even more difficult to accomplish.
When the clip comes near the free edges of the anterior and posterior central scallops (A2-P2) a series of changes occur in the coaptation point that impact the quantification of MR (figure 16): a) 2 or more regurgitant orifices are created (depending on the number of clips implanted) in the coaptation line adjacent to the device; b) the new orifices created show irregular geometries, which means that no circular or elliptical geometric assumptions should be made to this point; c) the device generates acoustic shadowing on the valve that interferes with the color Doppler echocardiography images (figure 2).7
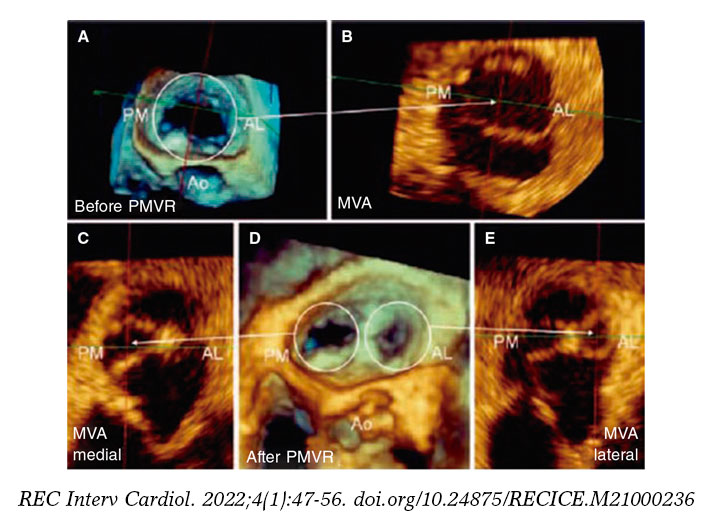
Figure 1. Three-dimensional transesophageal echocardiography image. A: mitral valve area (MVA) before percutaneous repair (Before PMVR) seen inside the circle. B: anterolateral (AL), and posteromedial (PM) commissure before clip implantation. The mitral valve area is shown here with an arrow. C: mitral valve area of the medial orifice (medial MVA) after clip implantation (shown by the arrow) outlined by the posteromedial (PL) commissure. D: double residual orifice after clip implantation (after PMVR); both the PM, and the AL are shown with circles. E: mitral valve area of the residual lateral orifice (lateral MVA) after clip implantation (shown by the arrow) and outlined by the AL commissure. Both residual orifices are found in different projections. Ao, aorta. Reproduced with permission from Ikenaga et al.5.
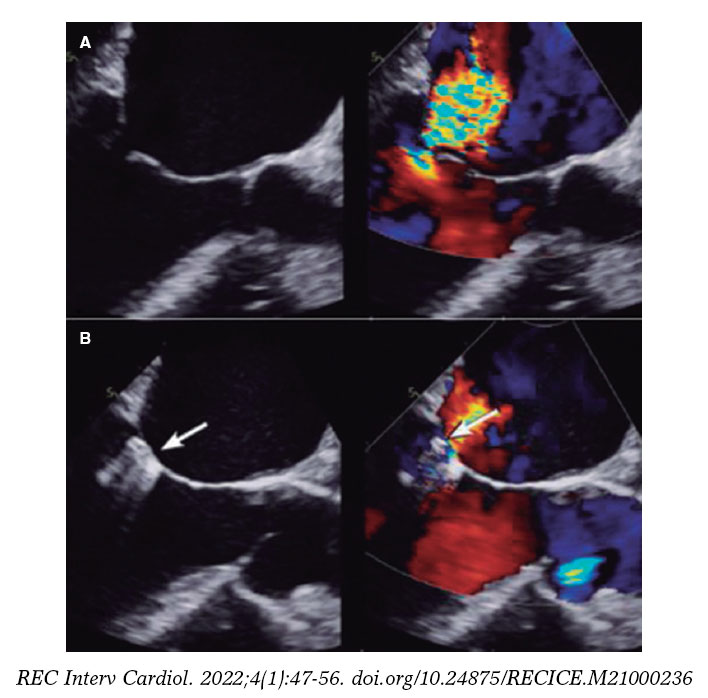
Figure 2. Two-dimensional transesophageal echocardiography image. A: mitral regurgitation before clip implantation. B: the clip appears like acoustic shadowing. The color image shows how difficult it is to assess the radius of the proximal isovelocity surface area (PISA) and the vena contracta due to clip interference (shown by the arrow). Reproduced with permission from Mayo Clinic.7
For this reason, the traditional assessment parameters of MR should not be applied to residual MR after clip implantation. However, a proper assessment is of paramount importance not only because it is key to a successful procedure, but also because it has prognostic value.8 Residual MR > 2/4 increases the risk of major adverse cardiovascular events, cardiac death, and mitral valve surgery or new percutaneous repair with clip implantation. Also, it is associated with a higher risk of disease progression in time, more symptoms, and a worse survival rate at the 12-month follow-up.8-11 On the other hand, implanting excessive clips can increase the transmitral gradient and cause mitral stenosis, which also increases the mortality rate at 12 months.12,13 Despite this prognostic significance there is no gold standard or guidelines with detailed recommendations based on observational trials or on assessments made by expert operators.
The initial trials (EVEREST I,14 COAPT,15 and MITRA-FR16) took measurements in core laboratories. In the case of the EVEREST I trial,14 the severity of residual MR was assessed using the color Doppler jet area, the pulmonary venous (PV) flow pattern, the regurgitant volume, and the regurgitant fraction. It is specifically described that neither the proximal isovelocity surface area (PISA) nor the vena contracta width (VCW) are used due to the visual limitations associated with the device when interfering with the image (figure 2).7 The COAPT trial specifies that the PISA was not obtained for the same reason. Also, that for the VCW, in case of multiple jets, the width of the predominant jet was selected or the widths of all the jets were added.17 However, the MITRA-FR trial only reported on the effective orifice area in 2D, and the regurgitant volume.16 There seem to be obvious disparities in the parameters used, reflecting the lack of consensus in this regard.
Results from scientific evidence are sometimes controversial. Only the guidelines published by the American Society of Echocardiography back in 20192 are available plus an expert consensus reached by the European Society of Echocardiography and the American Society of Echocardiography.18 Based on these documents, recommendations advocate for assessing regurgitation using transesophageal echocardiography (TEE) both intraoperative and immediately after the procedure while always bearing in mind the effect of sedation or general anesthesia.2 These guidelines give orientations on how to assess the severity of residual MR. However, no specific instructions are provided, leading to variable results in every center and leaving assessments to the operator’s experience.
METHODS
A bibliographic search was conducted on the main international databases (PubMed, Embase, and Cochrane) using the following MeSH terms: “mitral regurgitation AND MitraClip AND echocardiographic assessment”, “severity of residual mitral regurgitation after MitraClip”, “3D vena contracta area after MitraClip”, “TEE vena contracta after MitraClip”, “vena contracta area and MitraClip”, “vena contracta area after MitraClip”, “pulmonary venous flow after MitraClip”, “MitraClip and pulmonary flow”,” pulmonary venous flow and prediction of MitraClip”, “continuous doppler mitral regurgitation after MitraClip”, “mitral regurgitation doppler signal after MitraClip”, “doppler wave after MitraClip”, “transmitral doppler after MitraClip”, “E-wave after MitraClip”, “spontaneous contrast in LA after MitraClip”, “ratio VTI mitral and VTI LVOT after MitraClip”, “stroke volume after MitraClip”, “PISA after MitraClip”, and “EROA and PISA and MitraClip”. Filters in both English and Spanish were used without age limitations.
RESULTS
Evidence is based on small or mid-sized observational trials that use the assessments made by an expert operator or the parameters established by original—still unvalidated—trials as the reference standard. Based on the most recent consensus recommendations2 the specific evidence behind each parameter is described below:
Color Doppler echocardiography
It is a visual estimation of the size, number, origin, and direction of the jets. It often overestimates severity in case of multiple jets and underestimates it in case of eccentric jets.19 Still, it provides an early scan of regurgitant jets. Lin, et al.,20 and Altiok, et al.6 exposed that, although the regurgitant volume of MR is still the same due to 1 or multiple jets, the color Doppler jet area looks bigger with multiple jets, which leads to overestimating severity (figure 3).20 For these reasons, it is often discarded as an isolated parameter in clinical trials.
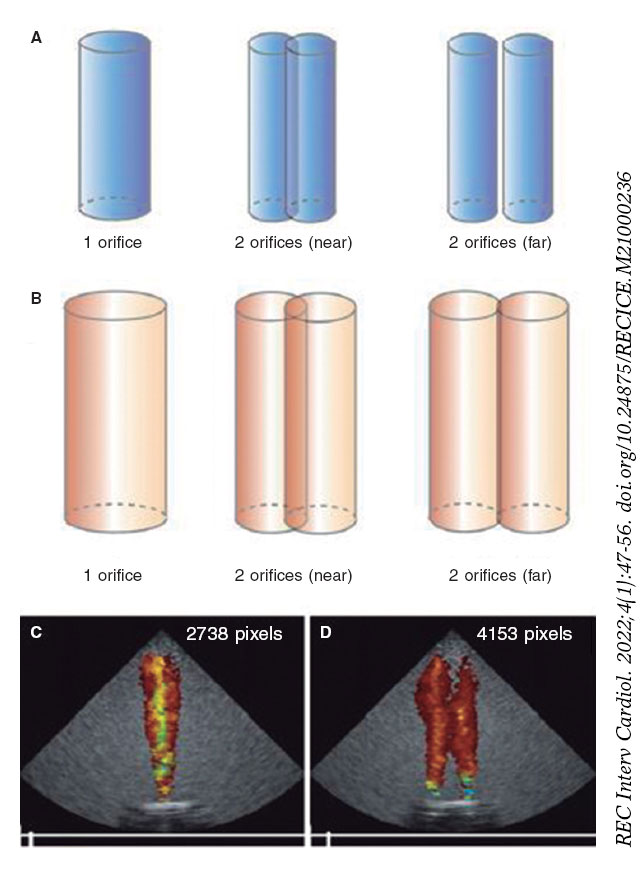
Figure 3. Impact of flow dynamics in the color Doppler jet area. The regurgitant volume from the ventricle towards the atrium creates interphase velocity between the former and atrial blood that generates surface shear stress where blood vortices that take more blood around them are produced. The color Doppler jet area looks magnified compared to the early regurgitant volume. A and B show that when the same regurgitant volume passes through 2 nearby or distant orifices with respect to one another, both jets merge due to the formation of vortices thus giving the impression of more severity. C and D show that for any given volume (eg, 10 mL), the number of pixels generated based on the number of orifices duplicates. Reproduced with permission from Lin et al.20.
Flow convergence region (the PISA radius)
To estimate the PISA radius-derived effective regurgitant orifice area (ROA) isovelocity hemispheres of convergent flow need to be created. When a clip stands in the way, these hemispheres cannot be created and the measurement is technically wrong.2 Therefore, in the case of multiple jets, eccentric jets or significant acoustic shadowing, severity is often under- or overestimated. The severity of regurgitation based on the sum of several PISAs has not been defined, which is why it cannot be used. Because of all these limitations, the early studies on percutaneous mitral valve repair with mitral clip14-16 did not include the study of the PISA (figure 2 and figure 4)7,21.
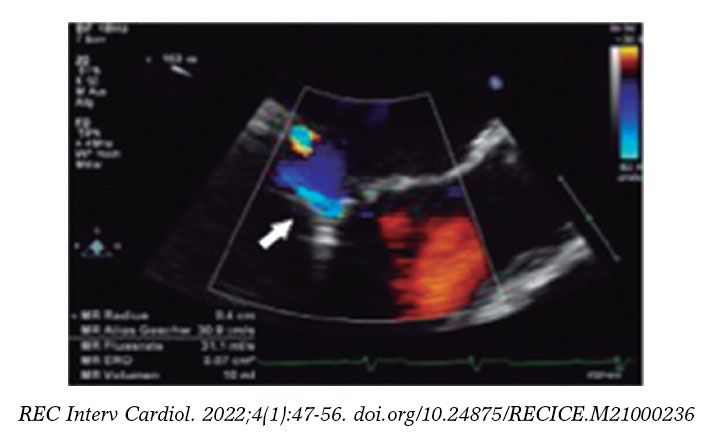
Figure 4. Two-dimensional transesophageal echocardiography image. Presence of acoustic shadowing due to clip implantation (arrow). Reproduced with permission from Lesevic et al.21.
Vena contracta width
If the regurgitant orifice cannot be clearly seen (small or eccentric jet, clip interference), this measure can come with an artifact (figure 5).22 It should be used carefully because it has not been validated yet or severity values established in case of multiple jets.14 To this date, no specific studies have been conducted supporting this parameter. The American guidelines2 only establish that a value ≥ 7 mm is specific of severity and since the COAPT trial used it in its assessment of residual MR,17 in practice, it could be used, especially in case of a predominant non-eccentric regurgitant jet. With eccentric jets, this measurement was less reliable (similar to native MR), which is why averaging several beats is advised,2 and why its use as an isolated parameter is ill-advised.
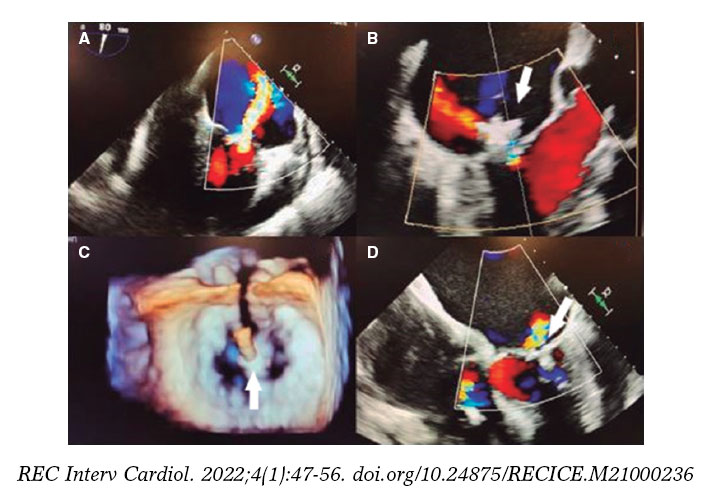
Figure 5. Two- and three-dimensional transesophageal echocardiography images. A: severe early mitral regurgitation. B: residual mitral regurgitation after clip implantation showing the clip interference (arrow) by just looking at the vena contracta. C: three-dimensional image of the clip (arrow) and the 2 residual orifices. D: color Doppler showing residual mitral regurgitation without visualization of vena contracta due to clip interference (arrow). Reproduced with permission from Elbey et al.22.
Three-dimensional vena contracta area
It allows us to better outline the regurgitant orifice, but with an associated risk of blooming artifacts (overexpression of the area when the Doppler color gain is set too high). Based on the consensus described above,2 it should be measured on each particular jet separately. Afterwards, the areas of of all regurgitant jets should be added.
The 3D-guided planimetry of the vena contracta area is one of the most studied parameters in the assessment of MR after clip implantation not only because it is highly accurate and reproducible, but also because of its low interobserver variability.21,23 Although this parameter was not used in the early studies,14 nowadays it has become more popular. That is because it outlines the orifice better, lacks geometric assumptions, and has none of the artifacts produced by other measurements (figure 6).24 It is often used because the most solid parameter to assess native MR is the regurgitant orifice area.19 Several studies have confirmed that the 3D-guided TEE direct planimetry is the most reproducible and accurate imaging modality to estimate it.6,13,23
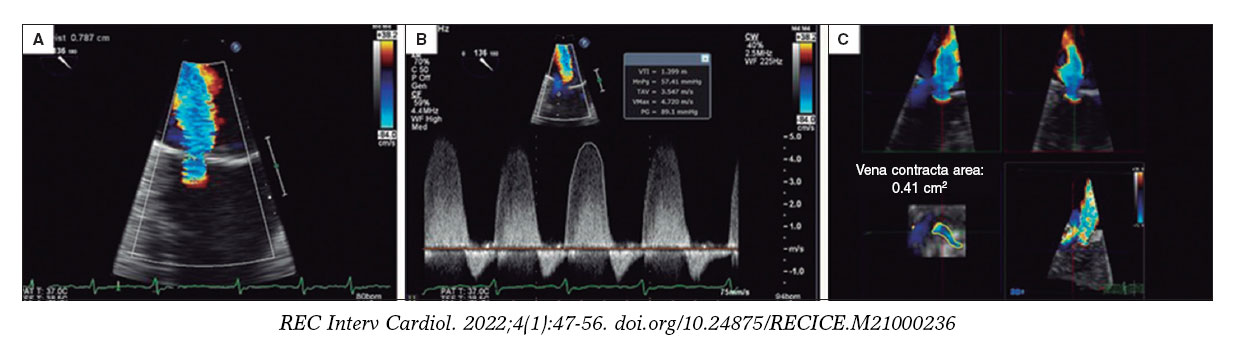
Figure 6. Two-dimensional transesophageal echocardiography image. A and B give an estimate of the effective regurgitant orifice area based on the proximal isovelocity surface area with a result of 0.32cm2. Two-dimensional estimate of the proximal isovelocity surface area: effective regurgitant orifice area = 2π*r2 *aliasing velocity/mitral regurgitation peak velocity = [6.28 × (0.79) 2 *38.2]/472 = 150/472 = 0.32cm2. C: when the measurement is taken using the 3D-guided direct planimetry, the result is 0.41cm2. The 3D-guided direct planimetry gives more accurate measurements of the orifice because it eliminates the artifacts caused by indirect measurements. Reproduced with permission from Katz et al.24.
Hyodo, et al.25 studied whether the 3D measurement of multiple vena contracta areas would be accurate enough to assess the severity of native valve MR. Until then, its utility was only known in single regurgitant jets. However, this was the first study to publish the results with multiple jets. Although this study has a small sample (n = 60), it proved that there is a high correlation between the 3D area and the ROA measured by thermodilution as the standard of use. This correlation was even more obvious in moderate or severe regurgitant jets, but it was overestimated in case of mild jets. After it was implemented on the native valve MR, its utility was assessed in patients with mitral clip. Avenatti et al.13 conducted a retrospective study of 155 patients on this issue. The areas of multiple jets were added, and the results obtained between the local echocardiography lab and the echocardiography experts from 2 high-volume centers were compared. In the receiver operating characteristic (ROC) curves, a threshold of 0.27cm2 was determined to identify moderate or more severe MR with an area under the curve of 0.81, and a negative predictive value of 92%. Although limited, their results are consistent with those from other registries and observational studies conducted in expert centers14,26 that advocate for the use of this new measurement. Still, validation studies are needed to this point. However, we should be cautious regarding the addition of different areas of several jets since only the 2 studies mentioned above with a total of 215 patients have been been published to this date.
Finally, Altiok, et al.6 shed more light on the utility of the vena contracta area measured on the 3D-guided echocardiography in residual MR. The regurgitant orifice areas measurements of residual MR obtained on the 2D transthoracic echocardiography (through the PISA) with 3D TEE (planimetry of the vena contracta area) were compared in 39 patients. In their results, interobserver variability was higher in 2D compared to 3D, which confirms the accuracy of the direct visualization of the regurgitant orifice compared to indirect measurements through the PISA that underestimate severity. Therefore, although it was not a 3D-guided validation study of the vena contracta, we can conclude that direct measurements of the vena contracta area through 3D TEE are reproducible and feasible in this population (figure 7 and figure 8).13
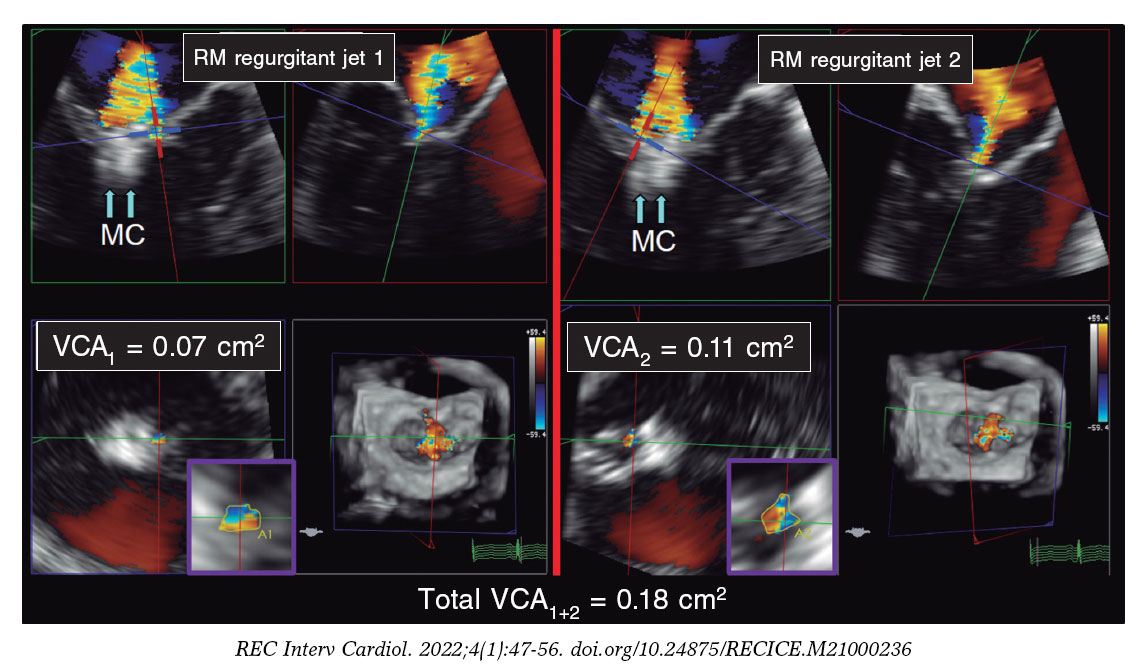
Figure 7. Two- and three-dimensional transesophageal echocardiography images. A: first mitral regurgitation jet (MR jet 1) after clip implantation (arrows, MC). B: second mitral regurgitation jet (MR jet 2) after clip implantation (arrows, MC). C: 3D-guided vena contracta area (VCA1) estimate of the first jet with a result of 0.07 cm2. D: 3D-guided vena contracta area (VCA2) estimate of the second jet with a result of 0.11 cm2. The sum of the 3D-guided vena contracta areas (total VCA1+2) is 0.18cm2. MC, MitraClip; MR, mitral regurgitation. VCA, vena contracta area. Reproduced with permission from Avenatti et al.13.
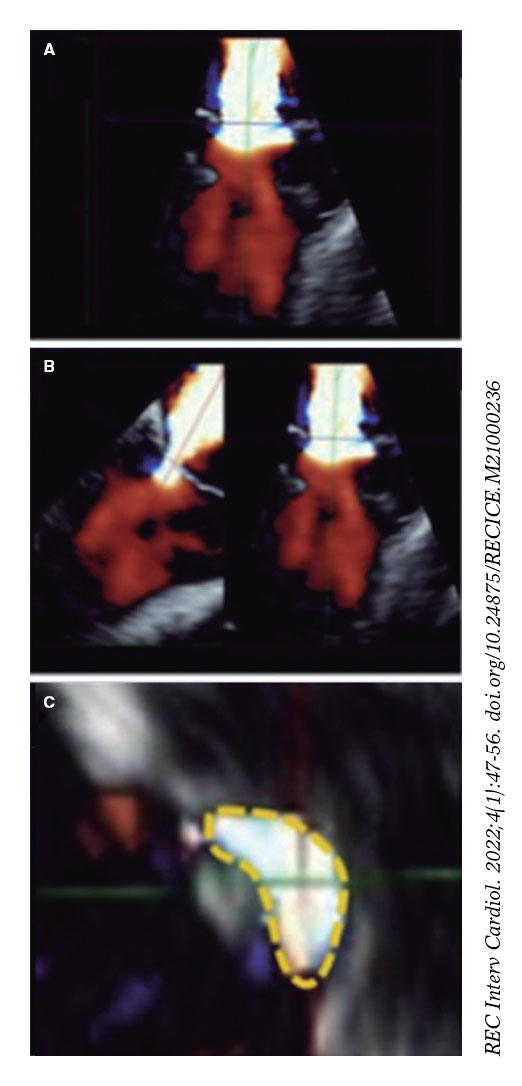
Figure 8. Two-dimensional transesophageal echocardiography image for the assessment of the vena contracta area. A: 3D color Doppler echocardiography of residual mitral regurgitation after clip implantation. B: axis alignment to obtain the 3D-guided vena contracta area. C: 3D-guided planimetry sketch. Reproduced with permission from Avenatti et al.13.
In conclusion, the 3D TEE of the vena contracta area is a promising parameter. As a matter of fact, it is the only one that would allow adding several jets.12 However, it is in its infancy and more evidence would be required to this point. It is an arduous method that requires software analysis and is subject to blooming artifacts that can overestimate the area. Also, if the regurgitant orifice area is measured with color, such measurement is affected by both the temporal resolution and configuration of the aliasing velocity (signal saturation) that is not standard in the different softwares available.12 In practice, these limitations complicate its application, which is why it is not the go-to parameter. Its utility can be greater in case of eccentric jets27 because in these jets there is usually an initial asymmetry between the leaflets, which is why the residual jet can be eccentric even though a clip may be properly implanted. The 3D-guided direct planimetry should be more precise like the study conducted by Utsonomiya et al. suggests.27 However, there is no more literature available on this regard.
Pulmonary venous flow pattern
This parameter is especially important given the assessment limitations of MR inside the valve. In case of severe regurgitation (3/4 or 4/4), the pulmonary systolic flow is totally or partially reversed in 1 or more pulmonary veins19,28 with respect to an increased pressure towards the left atrium (figure 9).29
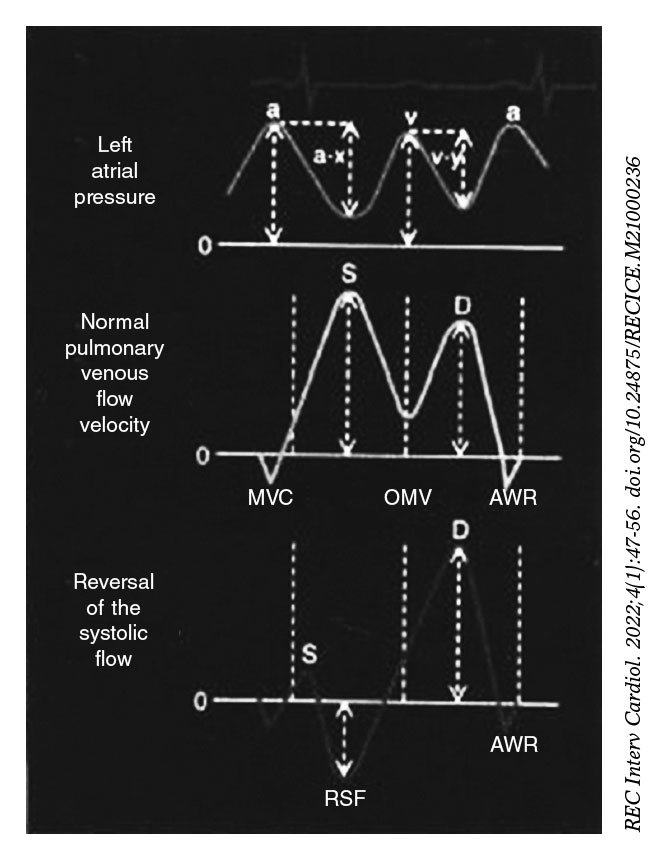
Figure 9. Scheme of atrial pressure waves and pulmonary flow. Up: left atrial pressure with the corresponding waves. Middle: normal pulmonary venous flow with a systolic wave > diastolic wave. Down: pulmonary venous flow with reversal of the systolic wave in the presence of severe mitral regurgitation. AWR, atrial wave reversal. MVC, mitral valve closure. OMV, opened mitral valve. RSF, reversal of the systolic flow. Reproduced with permission from Klein et al.29.
Similarly, its potential as a prognostic variable has been studied too. Ikenaga, et al.28 measured the systolic velocity-time integral (VTI)/diastolic VTI ratio in the left upper pulmonary vein (unless the right ones were visible and had more damage). Using the ROC curves, they established that a cut-off point of 0.72 had the best area under the curve (0.67) with a 61% sensitivity and a 73% specificity. Therefore, ratios < 0.72 were associated with more major adverse cardiovascular events (adjusted hazard ratio [HR] of 1.26; 95% confidence interval [95%CI], 1.01-1.54; P = .047). Since the pulmonary flow curve can be difficult to obtain, the same estimates were made with the peak systolic velocity/peak diastolic velocity ratio, that proved that the cut-off ratio with the best area under the curve (0.62) was 0.83. This parameter was also sig- nificantly associated with major adverse cardiovascular events at the 12-month follow-up (adjusted HR, 3. 05; 95%CI, 1.53-6.30; P = .002). Since pulmonary venous flow is associated with left atrial pressure,30 when MR drops, left atrial pressure decreases, and the pulmonary venous systolic component increases. When a new ROC curve was drew the peak systolic velocity/peak diastolic velocity ratio > 1.09 predicted left atrial pressures ≤ 12 mmHg (normal), a 71% sensitivity, and a 62% specificity. Peak systolic velocity/peak diastolic velocity ratios < 0.98 predicted left atrial pressures ≥ 20 mmHg, a 77% sensitivity, and a 71% specificity (figure 10 and figure 11).28 However, there are some limitations to this5,28 because, in case of atrial fibrillation, systolic flow is reduced following the loss of atrial contraction and relaxation. Also, in elderly patients, the rigidity of the atrium increases, and the systolic flow/diastolic flow ratio is lower. No standard cut-off values have been established and sometimes it is impossible to take any measurements due to the direction of the jet: for example, eccentric jets affect every pair of pulmonary veins differently causing artifacts that can impair the assessment of MR. The studies assessing pulmonary venous flow28 always compare the same pulmonary vein at baseline and after clip implantation. There are still very few studies on this matter. However, in combination with other parameters, it can be part of a comprehensive assessment strategy before and after clip implantation (figure 12 and figure 13).24,31
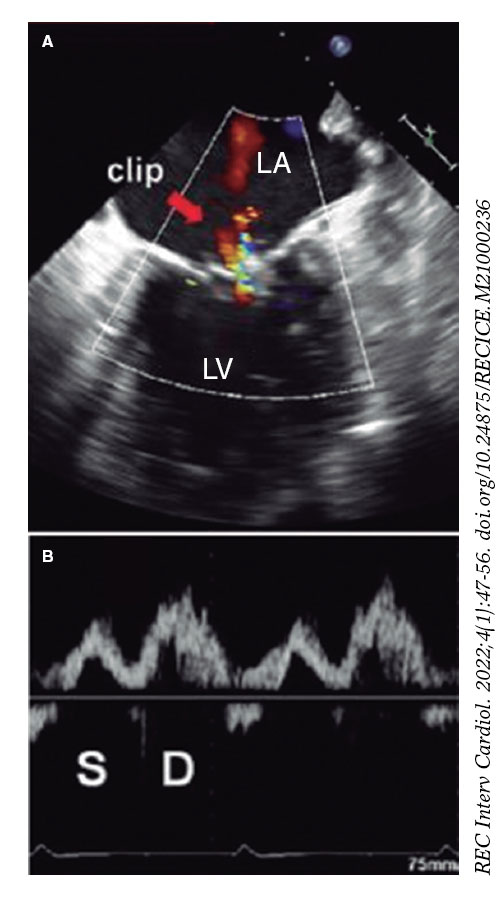
Figure 10. Two-dimensional transesophageal echocardiography image. A: color Doppler of residual mitral regurgitation after clip implantation (arrow). B: the corresponding blood flow at left upper pulmonary vein level is exposed with systolic (S) wave attenuation with respect to the diastolic (D) wave. The systolic velocity-time integral is 7.5 cm, and the diastolic one, 14 cm. The ratio between the 2 is 0.54, indicative of a higher risk of major adverse cardiovascular events. In this case, clip implantation is suboptimal. LA, left atrium, LV, left ventricle. Reproduced with permission from Ikenaga et al.28.
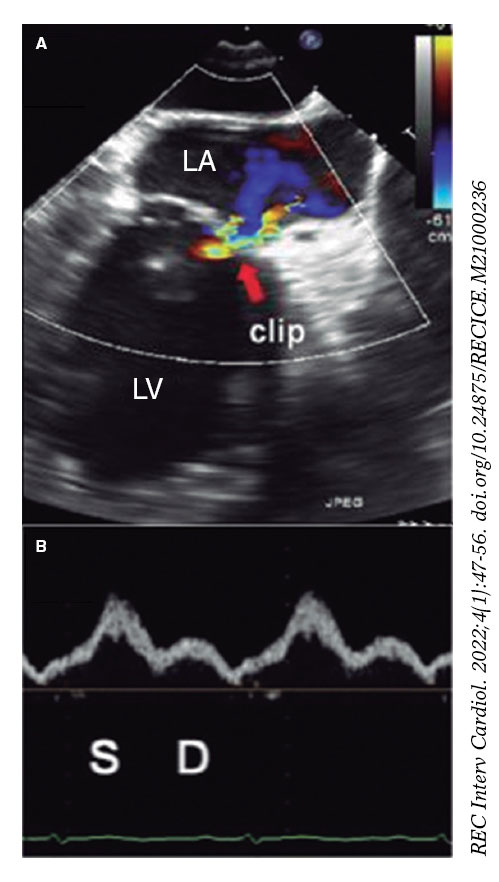
Figure 11. Two-dimensional transesophageal echocardiography image. A: color Doppler of residual mitral regurgitation after clip implantation (arrow). B: blood flow at left upper pulmonary vein level with a systolic wave (S) bigger than the diastolic (D) one. The systolic velocity-time integral was 23 cm, and the diastolic one, 10 cm with a ratio of 2.3, which is consistent with an optimal result at the follow-up. LA, left atrium. LV, left ventricle. Reproduced with permission from Ikenaga et al.28.
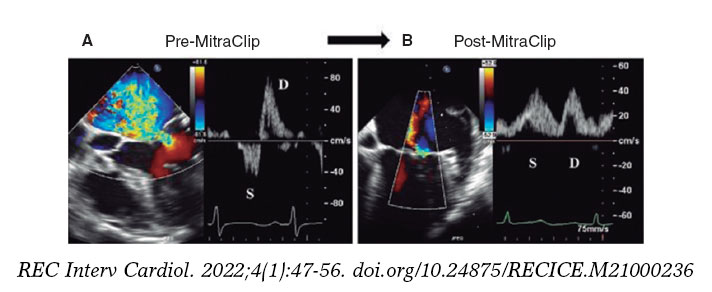
Figure 12. Two-dimensional transesophageal echocardiography image. A: color Doppler of severe mitral regurgitation (before mitral clip implantation) with pulmonary venous flow pattern. Reversal of the systolic (S) wave. B: presence of mitral regurgitation after clip implantation with corrected pulmonary venous flow pattern (systolic [S] wave > diastolic [D] wave). Reproduced with permission from Ikenaga et al.31.
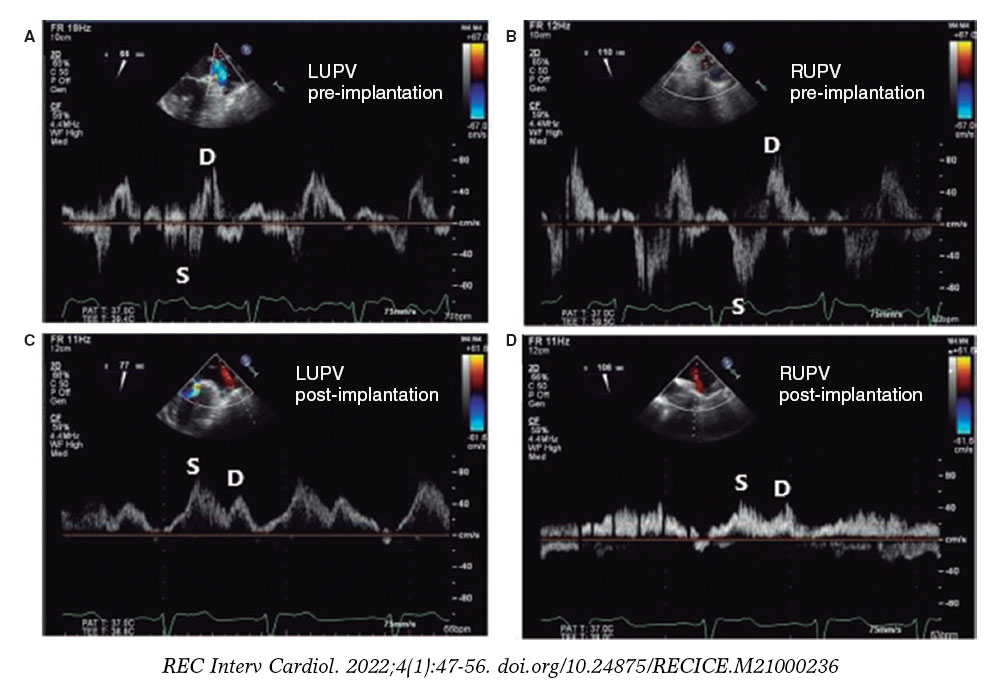
Figure 13. Images of pulmonary venous flow. A: blood flow at left upper pulmonary vein (LUPV) level before clip implantation with reversal of the systolic (S) wave with respect to the diastolic (D) wave. B: blood flow at right upper pulmonary vein (RUPV) flow level before clip implantation with reversal of systolic (S) wave with respect to the diastolic (D) one. C: blood flow at LUPV level after clip implantation with a systolic (S) wave bigger than the diastolic (D) one. D: blood flow at RUPV level after clip implantation with a systolic (S) wave bigger than the diastolic (D) one. Reproduced with permission from Katz et al.24.
Continuous-wave Doppler regurgitant jet
In native valve MR, the continuous-wave Doppler regurgitant jet can serve as an orientation. However, it is not sensitive enough to be used in isolation or to guide treatment.19 Similarly, in case of clip implantation, the greater the density of the color Doppler signal, the higher the chances of severity although in the presence of multiple jets, it cannot be assessed properly2 (figure 14).30 No studies on its utility have been conducted to this date.
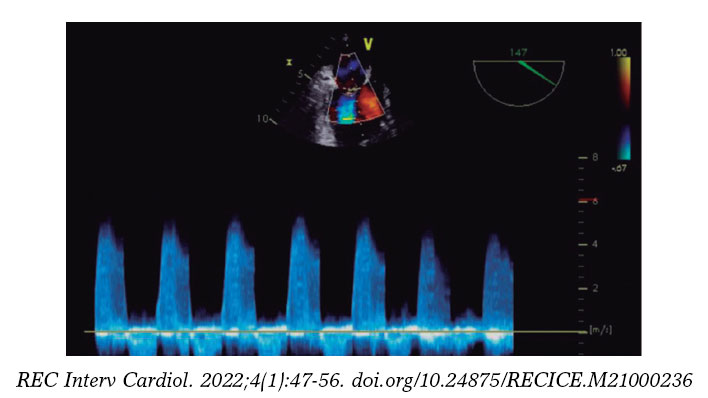
Figure 14. Transesophageal echocardiography image. Doppler image of a severe mitral regurgitation single jet. Its shape is triangular and density is high, suggestive of severity. Reproduced with permission from López-Opitz, and Moreno-Urrutia.30
Transmitral flow pattern by Doppler echocardiography
Slower E wave velocities are indicative of lower severities of native MR without quantifying it.2 It cannot be used to estimate residual MR after clip implantation because the approximation of the borders of the mitral leaflets generates higher transmitral gradients.30 Therefore, higher velocities are not indicative of significant residual MR.
Left atrial pressure with appearance of spontaneous contrast
The reduced volume of MR leads to atrial stasis (figure 15).32 It can be indicative of lower severity in the presence of spontaneous contrast.2 However, no studies have been conducted to this date.
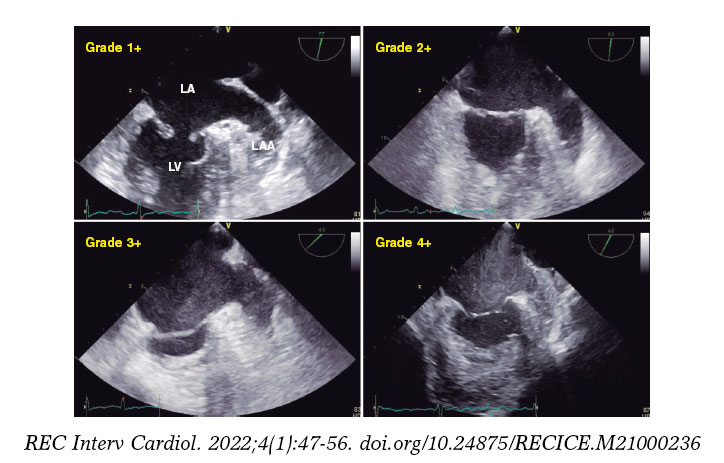
Figure 15. Two-dimensional transesophageal echocardiography image. A total of 4 different grades of spontaneous contrast can be seen in the atrium and the left atrial appendage going from lower to higher intensity (1+ to 4+). LA, left atrium; LAA, left atrial appendage; LV, left ventricle. Reproduced with permission from Ito and Suwa.32
Increased stroke volume in the left ventricular outflow tract
Same as before, an increased stroke volume can be indicative of reduced regurgitation. Still, the correlation between the left ventricular stroke volume and the severity of MR has not been studied, although we know that when it improves, MR often becomes attenuated.2
Estimating the regurgitant volume
It has not been validated in this context2 or in the multiple jet setting.
DISCUSSION
Residual MR after clip implantation conditions the patient’s prognosis. Whether moderate or severe, the 12-month mortality rate can be twice as high as that of patients with mild MR.13 Residual MR > moderate means persistent early clinical signs, and an increased left ventricular volume and cardiac remodeling. Similarly, if the severity of MR is not properly assessed intraoperatively, the number of clips required cannot be figured out. With too many clips, the risk of residual mitral stenosis is higher thus leading to worse prognosis.
The main limitation of the different studies conducted is that the standard of use is the assessment made by an expert operator. No single tool has proven capable of assessing MR easily, reproducibly, and regardless of the operator, which is why no validation studies can be conducted. Another limitation is that measurements taken under general anesthesia cause vasodilation, reduced ventricular afterload, and decreased MR. However, some studies published13,23 show reproducible results up to 4 weeks after the procedure, basically with the 3D-guided vena contracta area. Intraoperative assessment under general anesthesia has not proven to underestimate the severity of residual regurgitation at the follow-up.
More and more studies focus on the 3D-guided vena contracta area or in the pulmonary venous flow. Although with limitations, the results obtained are both reproducible and consistent. The 3D-guided vena contracta area seems to be more precise since the 3D planimetry assessment is direct. However, it is an arduous method regarding its applicability in the clinical practice. Hoping that this will change in the future, several working groups focus on the 3D-guided vena contracta area thanks to its scarce interobserver variability and its good correlation with the severity of MR measured by expert operators.
Pulmonary venous flow has been gaining interest lately because it translates the left atrial pressure that is determined by the severity of MR (although age and atrial rhythm also play a role). Even so, when flow is compared before and after the procedure, the difference is attributed to the effect of the clip. However, in the native valve MR, it is a highly specific, though not very sensitive, parameter. This can be extrapolated to residual regurgitation after device implantation.
CONCLUSIONS
The correct assessment of residual MR after mitral clip implantation has prognostic implications. However, the parameters used in native MR cannot be extrapolated because the clip causes a series of artifacts and morphological changes in the valve. Although some of these parameters (color Doppler echocardiography, transmitral flow, regurgitant volume, etc.) have not proven useful, others are promising. Both the 3D-guided vena contracta area and the pulmonary venous flow pattern are the 2 most promising parameters especially for their association with prognosis at the follow-up. Still, no validation studies have been conducted to this date. Standardizing software in all the centers and making 3D TEE available will be essential to further progress in the study of this valvular heart disease.
Residual MR after clip implantation has some peculiarities that make it ineligible to be assessed with the same parameters and values used with native MR. In practice, a comprehensive and efficient strategy is advised using the VCW and the variation of pulmonary venous flow plus, if possible, the 3D-guided vena contracta area.
Due to the rapid advance of this technique, updated manuscripts including data are required to be able to access the medical literature available. They should also include the prognostic significance of residual MR and encourage studies with enough scientific quality so that parameter validation studies can be conducted in the future. Also, so that the strategies used for residual MR assessment after mitral clip implantation can be standardized.
FUNDING
None.
AUTHORS’ CONTRIBUTIONS
S.P. Cabrera Huerta conducted the bibliographic search, selected the articles of interest, and wrote the content of this manuscript. J.A. de Agustín directed the study and its content, verified the bibliographic sources, and reviewed all the searches.
CONFLICTS OF INTEREST
None.
REFERENCES
1. Baumgartner H, Falk V, Bax JJ, et al. 2017 ESC/EACTS Guidelines for the management of valvular heart disease. Eur Heart J. 2017;38:2739-2791.
2. Zoghbi W, Asch FM, Bruce C, et al. Guidelines for the evaluation of valvular regurgitation after percutaneous valve repair or replacement. A report from the American Society of Echocardiography Developed in Collaboration with the Society for Cardiovascular Angiography and Interventions, Japanese Society of Echocardiography, and Society for Cardiovascular Magnetic Resonance. J Am Soc Echocardiogr. 2019;32:431-475.
3. Coats AJS, Anker SD, Baumbach A, et al. The management of secondary mitral regurgitation in patients with heart failure:a joint position statement from the Heart Failure Association (HFA), European Association of Cardiovascular Imaging (EACVI), European Heart Rhythm Association (EHRA), and European Association of Percutaneous Cardiovascular Interventions (EAPCI) of the ESC. Eur Heart J. 2021;42,1254-1269.
4. Otto CM, Nishimura RA, Bonow RO, et al. 2020 ACC/AHA Guideline for the Management of Patients With Valvular Heart Disease A Report of the American College of Cardiology/American Heart Association Joint Committee on Clinical Practice Guidelines. Circulation. 2021;143:e72-e227.
5. Ikenaga H, Makar M, Rader F, et al. Mechanisms of mitral regurgitation after percutaneous mitral valve repair with the MitraClip. Eur Heart J. 2020;10:1131-1143.
6. Altiok E, Hamada S, Brehmer K, et al. Analysis of procedural effects of percutaneous edge-to-edge mitral valve repair by 2D and 3D echocardiography. Circ Cardiovasc Imaging. 2012;6:748-755.
7. Mayo Clinic. MitraClip treatment of mitral regurgitation after cardiac transplant:Case report. 2020. Available online:https://www.mayoclinic.org/medical-professionals/cardiovascular-diseases/news/mitraclip-treatment-of-mitral-regurgitation-after-cardiac-transplant-case-report/mcc-20502193.Accessed 23 Mar2021.
8. Buzzatti N, De Bonis M, Denti P, et al. What is a “good“result after transcatheter mitral repair?Impact of 2+residual mitral regurgitation. J Thorac Cardiovasc Surg. 2016;1:88-96.
9. Reichart D, Kalbacher D, Rübsamen N, et al. The impact of residual mitral regurgitation after MitraClip therapy in functional mitral regurgitation. Eur J Heart Fail. 2020;22:1840-1848.
10. Paranskaya L, D'Ancona G, Bozdag-Turan I, et al. Residual Mitral Valve Regurgitation After Percutaneous Mitral Valve Repair with the MitraClip System is a Risk Factor for Adverse One-Year Outcome. Catheter Cardiovasc Interv. 2013;81:609-617.
11. Feldman T, Foster E, Glower DD, et al. Percutaneous Repair or Surgery for Mitral Regurgitation. N Engl J Med. 2011;364:1395-406.
12. Grayburn PA. The Challenge of Assessing Residual Mitral Regurgitation During MitraClip Procedures. Is 3D Vena Contracta Area the Answer? JACC Cardiovasc Interv. 2019:12;592-594.
13. Avenatti E, Mackensen B, El-Tallawi KC, et al. Diagnostic Value of 3-Dimensional Vena Contracta Area for the Quantification of Residual Mitral Regurgitation After MitraClip Procedure. JACC Cardiovasc Interv. 2019;12:582-591.
14. Foster E, Wasserman HS, Gray W, et al. Quantitative Assessment of Severity of Mitral Regurgitation by Serial Echocardiography in a Multicenter Clinical Trial of Percutaneous Mitral Valve Repair. Am J Cardiol. 2007;100:1577-1583.
15. Stone GW, Lindenfeld JA, Abraham WT, et al. Transcatheter Mitral-Valve Repair in Patients with Heart Failure. N Engl J Med. 2018;379:2307-2318.
16. Obadia JF, Messika-Zeitoun D, Leurent G, et al. Percutaneous Repair or Medial Treatment for Secondary Mitral Regurgitation. N Engl J Med. 2018;379:2297-2306.
17. Asch FM, Grayburn PA, Siegel RJ, et al. Echocardiographic Outcomes After Transcatheter Leaflet Approximation in Patients With Secondary Mitral Regurgitation. The COAPT Trial. J Am Coll Cardiol. 2019;74:2969-2979.
18. Zamorano JL, Badano LP, Bruce C, et al. EAE/ASE recommendations for the use of echocardiography in new transcatheter intervention for valvular heart disease. Eur Heart J. 2011;32:2189-2214.
19. Lancellotti P, Tribouilloy C, Hagendorff A, et al. Recommendations for the echocardiographic assessment of native valvular regurgitation:an executive summary from the European Association of Cardiovascular Imaging. Eur Heart J Cardiovasc Imaging. 2013;7:611-644.
20. Lin BA, Forouhar AS, Pahlevan NM, et al. Color Doppler jet area overestimates regurgitant volume when multiple jets are present. J Am Soc Echocardiogr. 2010;9:993-1000.
21. Lesevic H, Sonne C, Kasel AM, et al. Implantation of a MitraClip between two previously implanted MitraClips to treat recurrent severe mitral regurgitation. J Cardiol Cases. 2017;15:50-52.
22. Elbey MA, Palma Dallan LA, Ferragut G. Value of MitraClip in Reducing Funtional Mitral Regurgitation. US Cardiol Rev. 2019;13:30-34.
23. Dietl A, Prieschenk C, Eckert F, et al. 3D vena contracta area afterMitraClip procedure:precise quantification of residual mitral regurgitation and identification of prognostic information. Cardiovasc Ultrasound. 2018;16:1-10.
24. Katz WE, Conrad Smith AJ, Wrock FW, et al. Echocardiographic evaluation and guidance for Mitraclip procedure. Cardiovasc Diagn The. 2017;7:616-632.
25. Hyodo E, Iwata S, Tugcu A, et al. Direct measurement of multiple vena contracta areas for assessing the severity of mitral regurgitation using 3D TEE. JACC Cardiovasc Imaging. 2012;5:669-676.
26. Glower DD, Kar S, Trento A, et al. Percutaneous mitral valve repair for mitral regurgitation in high-risk patients:results of the EVEREST II study. J Am Coll Cardiol. 2014;64:172-181.
27. Utsonomiya H, Itabashi Y, Kobayashi S, et al. Comparison of mitral valve geometrical effect of percutaneous edge-to-edge repair between central and eccentric functional mitral regurgitation:clinical implications. Eur Heart J. 2019;4:455-466.
28. Ikenaga H, Yoshida J, Hayashi A, et al. Usefulness of Intraprocedural Pulmonary Venous Flow for Predicting Recurrent Mitral Regurgitation and Clinical Outcomes After Percutaneous Mitral Valve Repair With the MitraClip. JACC Cardiovasc Interv. 2019;12:140-150.
29. Klein A, Stewart WJ, Bartlett J, et al. Effects of Mitral Regurgitation on Pulmonary Venous Flow and Left Atrial Pressure:An Intraoperative Transesophageal Echocardiography Study. J Am Coll Cardiol. 1992;20:1345-1352.
30. López-Opitz JA, Moreno-Urrutia O. Insuficiencia mitral grave por perfo-ración del velo mitral posterior. RETIC. 2016;2:13-16.
31. Ikenaga H, Hayashi A, Nagaura T, et al. Relation Between Pulmonary Venous Flow and Left Atrial Pressure During Percutaneous Mitral Valve Repair With the MitraClip. Am J Cardiol. 2018;122:1379-1386.
32. Ito T, Suwa M. Left atrial spontaneous echo contrast:relationship with clinical and echocardiographic parameters. Echo Res Pract. 2019;6:65-73.
* Corresponding author: Servicio de Cardiología, Hospital Insular de Las Palmas, Avenida Marítima del Sur s/n, 35016 Las Palmas de Gran Canaria, Spain.
E-mail address: susicabrera_91@hotmail.com (S.P. Cabrera Huerta).