
ABSTRACT
Introduction and objectives: Geographical and organizational differences between different autonomous communities (AC) can generate differences in care for ST-segment elevation myocardial infarction (STEMI). A total of 17 heart attack code programs have been compared in terms of incidence rate, clinical characteristics, reperfusion therapy, delay to reperfusion, and 30-day mortality.
Methods: National prospective observational study (83 centers included in 17 infarction networks). The recruitment period was 3 months (April 1 to June 30, 2019) with clinical follow-up at 30 days.
Results: 4366 patients with STEMI were included. The incidence rate was variable between different AC (P < .0001), as was gender (P = .003) and the prevalence of cardiovascular risk factors (P < .0001). Reperfusion treatment was primary angioplasty (range 77.5%-97.8%), fibrinolysis (range 0%-12.9%) or no treatment (range 2.2%- 13.5%). The analysis of the delay to reperfusion showed significant differences (P < .001) for all the intervals analyzed. There were significant differences in 30-days mortality that disappeared after adjusting for clinical and healthcare network characteristics.
Conclusions: Large differences in STEMI care have been detected between the different AC, in terms of incidence rate, clinical characteristics, reperfusion treatment, delay until reperfusion, and 30-day mortality. The differences in mortality disappeared after adjusting for the characteristics of the patient and the care network.
Keywords: STEMI. Population characteristics. Angioplasty.
RESUMEN
Introducción y objetivos: Las diferencias geográficas y organizativas entre distintas comunidades autónomas (CCAA) pueden generar diferencias en la atención al infarto agudo de miocardio con elevación del segmento ST (IAMCEST). Se han comparado 17 programas de Código Infarto en términos de incidencia, características clínicas, tratamiento de reperfusión, retraso hasta la reperfusión y mortalidad a 30 días.
Métodos: Estudio observacional prospectivo nacional (83 centros en 17 redes de infarto). El periodo de selección fue de 3 meses (1 de abril a 30 de junio de 2019), con seguimiento clínico a 30 días.
Resultados: Se incluyeron 4.366 pacientes con IAMCEST. La tasa de incidencia fue variable entre las CCAA (p < 0,0001), igual que el sexo (p = 0,003) y la prevalencia de factores de riesgo cardiovascular (p < 0,0001). El tratamiento de reperfusión fue angioplastia primaria (rango 77,5-97,8%), fibrinolisis (rango 0- 12,9%) o ninguno (rango 2,2-13,5%). El análisis del retraso hasta la reperfusión mostró diferencias significativas (p < 0,001) para todos los intervalos analizados. Hubo diferencias significativas en la mortalidad cruda a 30 días que desaparecieron tras ajustar por las características clínicas y dependientes de la red asistencial (primer contacto, tiempo hasta la reperfusión y abordaje de críticos).
Conclusiones: Se han detectado diferencias en la atención al IAMCEST entre las distintas CCAA, en términos de incidencia, características clínicas, tratamiento de reperfusión, retraso hasta la reperfusión y mortalidad a 30 días. Las diferencias en mortalidad desaparecen tras ajustar por las características del paciente y de la red asistencial.
Palabras clave: IAMCEST. Características de la población. Angioplastia.
Abbreviations
ACI-SEC: Interventional Cardiology Association at the Spanish Society of Cardiology. AC: autonomous communities. pPCI: primary percutaneous coronary intervention. STEMI: ST-segment elevation myocardial infarction.
INTRODUCTION
Infarction Code networks are key to treat ST-segment elevation myocardial infarction (STEMI) in the shortest time possible while optimizing reperfusion therapy.1 In Spain we have 17 different public regional STEMI networks, 1 in each autonomous community (AC) for a total of 83 pPCI-capable hospitals in programs on a 24/7/365 basis.2 According to data from the Annual Activity Registry of the Interventional Cardiology Association of the Spanish Society of Cardiology (ACI-SEC), back in 2019, a total of 22 529 interventional procedures were performed in patients with infarction.3 Recently, an analysis of the ACI-SEC Infarction Code Registry revealed the characteristics of infarction care in Spain with 87.5%, 4.4%, and 8.1% of the patients with STEMI being treated with pPCI, fibrinolysis, and without reperfusion, respectively. The 30-day mortality rate of STEMI was 7.9% dropping down to 6.8% in patients treated with pPCI.4
The geographical differences and heterogeneity of the organizational infrastructure among the different Infarction Code programs available can lead to regional differences as a survey conducted among health professionals involved in these programs revealed recently.5 These organizational differences can have an impact on the management of patients with STEMI. Their analysis and AC-based comparison facilitates finding matters where there is room for improvement to optimize treatment.
This analysis compared the incidence rate, clinical characteristics, type and time to reperfusion, the characteristics of pPCI, and the 30-day mortality rate of 17 different regional programs of the Infarction Code in Spain.
METHODS
Study design
The Registry design has already been introduced4. In conclusion, this was a national, observational, and prospective study of 83 centers from 17 different regional STEMI networks. The patients’ recruitment period was 3 months—from April 1 through June 30, 2019—with a 30-day clinical follow-up.
Registry protocol was approved by the reference central ethics committee that did not deem the obtention of the informed consent necessary since data anonymity was guaranteed at any time.
Inclusion criteria
All consecutive patients who, during the study period, triggered the activation of different regional infarction care networks with a final diagnosis of STEMI and met the following criteria were included in the study: a) diagnosis of ST-segment elevation acute coronary syndrome with symptoms consistent with acute coronary syndrome, electrocardiogram showing ST-segment elevation or new-onset left bundle branch block or suspected posterior infarction of, at least, 24-hour evolution since symptom onset or b) recovered cardiac arrest with suspected coronary etiology or c) cardiogenic shock with suspected coronary etiology.
Definition and collection of variables
Clinical variables were registered in an online form and previously published.4 The definitions of the different time intervals since symptom onset until reperfusion were given based on the recommendations established by the European clinical practice guidelines on the management of STEMI.1 Subjective judgment from a local investigator was requested on the delay sustained by the patient since his first medical contact (existence of unjustified delay—yes/no—and reason why). To estimate the incidence rate (number of cases per million inhabitants) population data from the National Statistics Institute from 2019 were used.6 Regarding the mortality adjusted analysis, the following characteristics of the care network were defined: the individual responsible for the first medical contact (emergency medical services, health center, non-pPCI-capable hospital, pPCI-capable hospital), time to reperfusion, and location where critical care was administered (intensive care unit or cardiac surgery intensive care unit).
Statistical analysis
Continuous variables were expressed as mean ± standard deviation. The categorical ones were expressed as frequencies and percentages. Inter-group comparisons of baseline variables were conducted using the chi-square test or the Student t test, when appropriate. Times to reperfusion were expressed as median and interquartile range and compared using the Mann-Whitney U test.
Poisson regression coefficient was used to estimate the 30-day mortality rate of each AC including patient-dependent factors (the confounding factors included were age, sex, hypertension, diabetes, dyslipidemia, smoking, previous ischemic heart disease, Killip classification, and anterior location of STEMI), and the healthcare network involved (location of the first medical contact, time between the onset of pain and reperfusion, and location where critically ill patients were treated).
The variable AC was introduced in the model in a second step, and a test of ratio of verisimilitude was performed to verify its statistical significance. When the AC variable was added, adjusted associations were obtained between AC and mortality. The Poisson regression coefficients became incidence rates using the marginal effect function. The estimated 30-day mortality rate for each AC was obtained from a mean distribution of confounding factors, which facilitated comparing mortality rate across the different AC. This method had been previously used in the acute myocardial infarction setting.7-9 Since there could be a selection bias across the different AC in patients without reperfusion therapy, these were not included in the adjusted mortality analysis.
P values < .05 were considered statistically significant. The STATA statistical software package version 15 SE (Stata Corp, College Station, United States) was used.
RESULTS
Patients
The registry included a total of 5401 patients, 4366 (81.2%) of whom had a final diagnosis of STEMI. The 888 patients (16.4%) with a diagnosis different from STEMI and the 147 (2.7%) without a final diagnosis were excluded from the analysis. Figure 1 shows the flow of patients and the AC-based distribution. Figure 2 shows the number of patients treated across the different AC plus the final diagnosis achieved adjusted by million inhabitants.6 Table 1 shows the clinical characteristics of patients with STEMI across the different AC.
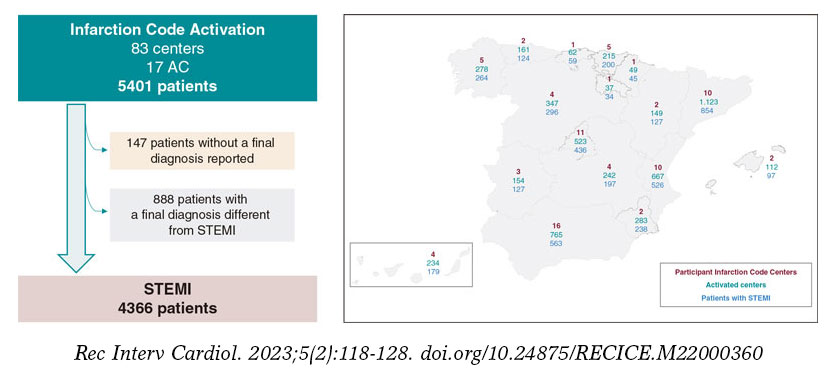
Figure 1. Flow of patients and distribution across the different autonomous communities (AC) based on participant centers, number of codes activated, and number of patients with ST-segment elevation myocardial infarction (STEMI) as final diagnosis.
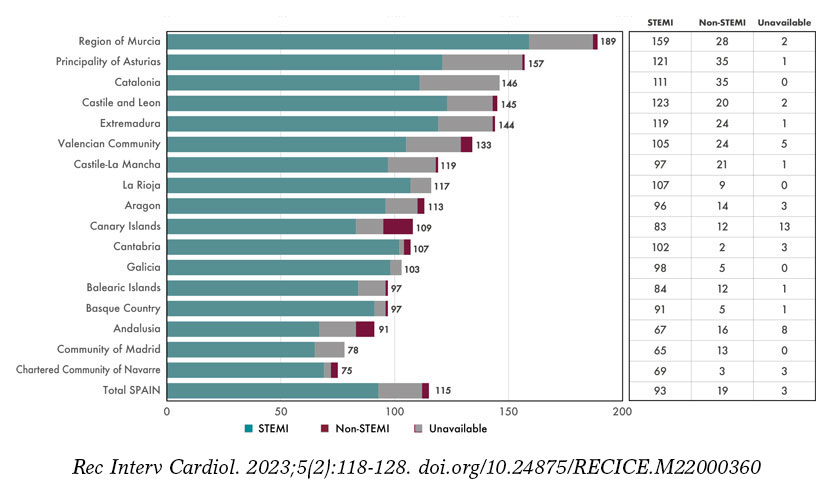
Figure 2. Patients treated across the different autonomous communities (AC) adjusted for million inhabitants. AC were arranged from largest to smallest number of patients treated per million inhabitants. Regarding the population estimate per million inhabitants, population data from the National Statistics Institute were used.6 STEMI, ST-segment elevation myocardial infarction.
Table 1. Clinical characteristics of patients with ST-segment elevation myocardial infarction treated in the Infarction Code networks per autonomous community
| Age, years | Sex, women | AHT | Diabetes | Dyslipidemia | Active smoking | Previous IHD | Previous PCI | Previous stroke | Early Killip I | Early Killip IV | Anterior location | |
|---|---|---|---|---|---|---|---|---|---|---|---|---|
| Andalusia | 63 ± 13 | 110/563 (19.5) | 297/560 (53.0) | 159/558 (28.5) | 252/559 (45.1) | 264/557 (47.4) | 60/561 (10.7) | 59/559 (10.6) | 31/556 (5.6) | 423/541 (78.2) | 31/541 (5.7) | 223/521 (42.8) |
| Aragon | 65 ± 14 | 30/127 (23.6) | 62/127 (48.8) | 28/125 (22.4) | 56/127 (44.1) | 59/124 (47.6) | 13/124 (10.5) | 17/126 (13.5) | 7/122 (5.7) | 99/124 (79.8) | 13/124 (10.5) | 56/120 (46.7) |
| Principality of Asturias | 66 ± 13 | 40/124 (32.3) | 61/124 (49.2) | 34/122 (27.9) | 54/124 (43.6) | 41/123 (33.3) | 20/123 (16.3) | 19/123 (15.4) | 7/123 (5.6) | 96/123 (78.1) | 11/123 (8.9) | 57/122 (46.7) |
| Balearic Islands | 63 ± 12 | 28/97 (28.9) | 44/94 (46.8) | 21/94 (22.3) | 49/93 (52.7) | 49/93 (52.7) | 14/93 (15.1) | 14/94 (14.9) | 4/92 (4.4) | 71/96 (74.0) | 5/96 (5.2) | 30/92 (32.6) |
| Canary Islands | 60 ± 12 | 40/178 (22.5) | 99/178 (55.6) | 52/178 (29.2) | 102/177 (57.6) | 93/178 (52.3) | 22/178 (12.4) | 18/178 (10.1) | 8/176 (4.6) | 146/168 (86.9) | 14/168 (8.3) | 65/163 (39.9) |
| Cantabria | 62 ± 13 | 15/59 (25.4) | 31/59 (52.5) | 21/58 (36.2) | 27/58 (46.6) | 31/57 (54.4) | 10/58 (17.2) | 10/59 (17.0) | 3/57 (5.3) | 46/56 (83.9) | 2/56 (3.6) | 25/58 (43.1) |
| Castile and Leon | 64 ± 13 | 56/296 (18.9) | 146/293 (49.8) | 73/291 (25.1) | 126/292 (43.2) | 117/292 (40.1) | 31/293 (10.6) | 31/294 (10.5) | 12/176 (4.1) | 236/287 (82.2) | 17/287 (5.9) | 138/280 (49.3) |
| Castile-La Mancha | 64 ± 13 | 26/197 (13.2) | 108/194 (55.7) | 58/192 (30.2) | 99/196 (50.5) | 92/193 (47.7) | 19/192 (9.9) | 18/194 (9.3) | 9/194 (4.6) | 157/196 (80.1) | 12/196 (6.1) | 89/194 (45.9) |
| Catalonia | 63 ± 13 | 195/854 (22.8) | 393/854 (46.0) | 198/854 (23.2) | 340/854 (39.8) | 354/854 (41.4) | 60/854 (7.0) | 62/854 (7.3) | 30/854 (3.5) | 683/826 (82.7) | 67/826 (8.1) | 351/767 (45.8) |
| Extremadura | 63 ± 13 | 18/127 (14.2) | 74/127 (58.3) | 26/126 (20.6) | 52/126 (41.3) | 48/127 (37.8) | 17/126 (13.5) | 14/126 (11.1) | 4/127 (3.2) | 91/122 (74.6) | 11/122 (9.0) | 56/121 (46.3) |
| Galicia | 63 ± 13 | 63/264 (23.9) | 130/262 (49.6) | 48/259 (18.5) | 138/261 (52.9) | 100/215 (46.5) | 18/261 (6.9) | 25/262 (9.5) | 12/263 (4.6) | 195/251 (77.7) | 31/251 (12.4) | 103/233 (44.2) |
| La Rioja | 59 ± 12 | 8/34 (23.5) | 14/34 (41.2) | 3/34 (8.8) | 16/34 (46.1) | 20/34 (58.8) | 1/34 (3.0) | 2/34 (5.9) | 0/34 (0) | 30/34 (88.2) | 3/34 (8.8) | 11/34 (32.4) |
| Community of Madrid | 63 ± 13 | 105/436 (24.1) | 212/432 (49.1) | 88/430 (20.5) | 208/431 (48.3) | 177/428 (41.4) | 41/429 (9.6) | 43/429 (10.0) | 11/429 (2.6) | 347/424 (81.8) | 35/424 (8.3) | 174/419 (41.5) |
| Region of Murcia | 64 ± 13 | 43/238 (18.1) | 127/237 (53.6) | 71/237 (30.0) | 100/237 (42.4) | 110/237 (46.4) | 41/237 (17.3) | 24/151 (15.9) | 3/151 (2.0) | 196/237 (82.7) | 18/237 (7.6) | 101/231 (43.7) |
| Chartered Community of Navarre | 65 ± 14 | 14/45 (31.1) | 18/44 (40.9) | 9/45 (20.0) | 29/45 (64.4) | 16/45 (35.6) | 3/45 (6.7) | 4/44 (9.1) | 3/45 (6.7) | 31/43 (72.1) | 4/43 (9.3) | 16/44 (36.4) |
| Basque Country | 64 ± 14 | 52/200 (26.0) | 101/197 (51.3) | 39/197 (19.8) | 101/198 (51.0) | 89/197 (45.2) | 26/195 (13.3) | 32/196 (16.3) | 11/193 (5.7) | 169/200 (84.5) | 12/200 (6.0) | 83/199 (41.7) |
| Valencian Community | 63 ± 13 | 119/526 (22.6) | 293/519 (56.5) | 163/514 (31.7) | 212/514 (41.3) | 235/514 (45.7) | 56/515 (10.9) | 53/511 (10.4) | 21/513 (4.1) | 445/520 (85.6) | 34/520 (6.5) | 217/503 (43.1) |
| P | .054 | .003 | .038 | < .0001 | < .0001 | .007 | < .0001 | .011 | .61 | .016 | .25 | .44 |
| Total | 63 ± 13 | 962/4365 (22.0) | 2210/4335 (51.0) | 1091/4314 (25.3) | 1961/4326 (45.3) | 1895/4268 (44.4) | 452/4318 (10.5) | 445/4234 (10.5) | 176/4222 (4.2) | 3462/4248 (81.5) | 320/4248 (7.5) | 1795/4101 (43.8) |
AHT, arterial hypertension; IHD, ischemic heart disease; PCI, percutaneous coronary intervention. | ||||||||||||
Reperfusion therapy used in patients with ST-segment elevation myocardial infarction
Out of the 4366 patients with STEMI, 3792 (86.9%) received pPCI, 189 (4.3%) fibrinolysis, and 353 (8.1%) no reperfusion therapy whatsoever. No reperfusion therapy was reported in 32 patients (0.7%). Figure 3 shows treatment distribution based on AC. Table 2 shows, across different AC and patients treated with cardiac catheterization, the angiographic findings and characteristics of interventional therapy had this procedure been performed.
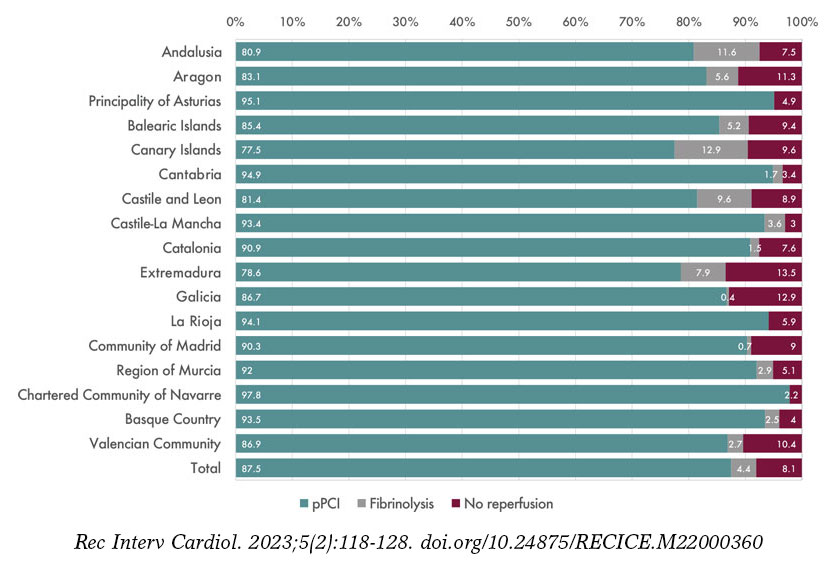
Figure 3. Distribution of reperfusion therapy in patients with ST-segment elevation myocardial infarction by autonomous communities. pPCI, primary percutaneous coronary intervention.
Table 2. Angiographic findings and characteristics of interventional procedures in patients with ST-segment elevation myocardial infarction treated with cardiac catheterization per autonomous community
| Radial access | No. of diseased vessels | Early TIMI grade-0/1 flow | Final TIMI grade-3 flow | Need for hemodynamic support | Thrombus aspiration in IRA | BMS implantation in IRA | DES implantation in IRA | pPCI | Bailout PCI | Elective PCI after fibrinolysis | Coronary angiography without PCI | |
|---|---|---|---|---|---|---|---|---|---|---|---|---|
| Andalusia | 456/534 (85.4) | 1.49 ± 0.69 | 416/535 (77.8) | 502/536 (93.7) | 15/563 (2.7) | 76/563 (13.5) | 48/563 (8.5) | 456/563 (81.0) | 471/557 (84.6) | 36/557 (6.5) | 27/557 (4.9) | 23/557 (4.1) |
| Aragon | 111/122 (91.0) | 1.62 ± 0.78 | 90/120 (75.0) | 114/122 (93.4) | 5/127 (3.9) | 41/127 (32.3) | 0/127 (0) | 103/127 (81.1) | 108/124 (87.1) | 6/124 (4.8) | 1/124 (0.8) | 9/124 (7.3) |
| Principality of Asturias | 99/121 (81.8) | 1.54 ± 0.77 | 106/121 (87.6) | 111/121 (91.7) | 5/124 (4.0) | 39/124 (31.5) | 10/124 (8.1) | 98/124 (79.0) | 118/123 (95.9) | 0/123 (0) | 0/123 (0) | 5/123 (4.1) |
| Balearic Islands | 79/92 (85.9) | 1.46 ± 0.67 | 67/92 (72.8) | 85/92 (92.4) | 0/124 (0) | 27/97 (27.8) | 4/97 (4.1) | 80/97 (82.5) | 89/96 (92.7) | 4/96 (4.2) | 0/96 (0) | 3/96 (3.1) |
| Canary Islands | 138/169 (81.7) | 1.54 ± 0.76 | 131/170 (77.1) | 155/169 (91.7) | 6/179 (3.6) | 29/179 (16.2) | 3/179 (1.7) | 150/179 (83.8) | 145/176 (82.4) | 6/176 (3.4) | 15/176 (8.5) | 10/176 (5.7) |
| Cantabria | 17/56 (30.4) | 1.50 ± 0.68 | 51/57 (89.5) | 55/56 (98.2) | 1/59 (1.7) | 31/59 (52.5) | 0/59 (0) | 51/59 (86.4) | 57/59 (96.6) | 0/59 (0) | 1/59 (1.7) | 1/59 (1.7) |
| Castile and Leon | 263/281 (93.6) | 1.55 ± 0.74 | 192/241 (79.7) | 225/247 (91.1) | 15/296 (5.1) | 27/296 (9.1) | 9/296 (3.0) | 249/296 (84.1) | 255/291 (96.6) | 12/291 (4.1) | 16/291 (5.5) | 8/291 (2.8) |
| Castile-La Mancha | 164/191 (85.9) | 1.68 ± 0.73 | 164/192 (85.4) | 186/190 (97.9) | 9/197 (4.6) | 75/197 (38.1) | 10/197 (5.1) | 172/197 (97.3) | 185/196 (94.4) | 2/196 (1.0) | 4/196 (2.0) | 5/196 (2.6) |
| Catalonia | 727/781 (93.1) | 1.48 ± 0.70 | 594/844 (70.4) | 787/827 (95.2) | ND | 259/854 (30.3) | 117/854 (13.7) | 653/854 (76.5) | 807/849 (95.1) | 8/849 (0.9) | 3/849 (0.4) | 31/849 (3.7) |
| Extremadura | 119/121 (98.4) | 1.65 ± 0.79 | 104/122 (85.3) | 104/122 (85.3) | 6/127 (4.7) | 18/127 (14.2) | 12/127 (11.0) | 98/127 (77.2) | 112/126 (88.9) | 8/126 (6.4) | 2/126 (1.6) | 4/126 (3.2) |
| Galicia | 228/242 (94.2) | 1.53 ± 0.84 | 182/229 (79.5) | 214/229 (93.5) | 20/264 (7.6) | 77/264 (29.2) | 4/264 (1.5) | 215/264 (81.4) | 246/264 (93.2) | 0/264 (0) | 0/264 (0) | 18/264 (6.8) |
| La Rioja | 29/34 (85.3) | 1.15 ± 0.36 | 30/34 (88.2) | 31/34 (91.2) | 0/24 (0) | 10/34 (29.4) | 3/34 (8.8) | 27/34 (79.4) | 33/34 (97.1) | 0/34 (0) | 0/34 (0) | 1/34 (2.9) |
| Community of Madrid | 395/421 (93.8) | 1.48 ± 0.69 | 329/402 (81.8) | 392/425 (92.2) | 23/436 (5.3) | 80/436 (18.4) | 15/436 (3.4) | 352/436 (80.5) | 421/434 (97.0) | 3/434 (0.7) | 0/434 (0) | 10/434 (2.3) |
| Region of Murcia | 213/237 (89.9) | 1.48 ± 0.64 | 175/234 (74.8) | 223/236 (94.5) | 4/238 (1.7) | 56/238 (23.5) | 5/238 (2.1) | 209/238 (87.2) | 226/238 (95.0) | 7/238 (2.9) | 0/238 (0) | 5/238 (2.1) |
| Chartered Community of Navarre | 31/36 (86.1) | 2.00 ± 0.86 | 34/43 (79.1) | 39/45 (86.7) | 6/45 (13.3) | 22/45 (48.9) | 2/45 (4.4) | 39/45 (86.7) | 44/45 (97.8) | 0/45 (0) | 0/45 (0) | 1/45 (2.2) |
| Basque Country | 179/198 (90.4) | 1.51 ± 0.67 | 153/198 (77.3) | 191/199 (96.0) | 7/200 (3.5) | 100/200 (50.0) | 3/200 (1.5) | 174/200 (87.0) | 194/199 (97.5) | 4/199 (2.0) | 1/199 (0.5) | 0/199 (0) |
| Valencian Community | 484/514 (94.2) | 1.59 ± 0.76 | 390/496 (78.6) | 461/497 (92.8) | 8/256 (1.5) | 145/526 (27.6) | 34/526 (6.5) | 423/526 (80.4) | 482/518 (93.1) | 10/518 (1.9) | 4/518 (0.8) | 22/518 (4.3) |
| P | < .0001 | .84 | < .0001 | .002 | < .0001 | < .0001 | < .0001 | .004 | < .0001 | |||
| Total | 3732/4150 (89.9) | 1.50 ± 0.71 | 3208/4130 (77.7) | 3875/4147 (93.4) | 110/4366 (2.5) | 1112/4366 (25.5) | 281/4366 (6.4) | 3548/4366 (81.3) | 3992/4329 (92.2) | 106/4329 (2.5) | 74/4329 (1.7) | 157/4329 (3.6) |
BMS, bare metal stent; CL, cath lab; DES, drug-eluting stent; ECG, electrocardiogram; EMS, emergency medical services; FMC, first medical contact; IRA, infarct-related artery; PCI, percutaneous coronary intervention; pPCI, primary percutaneous coronary intervention. | ||||||||||||
Time intervals between symptom onset and reperfusion in patients with ST-segment elevation myocardial infarction treated with primary percutaneous coronary intervention
Table 3 shows time intervals between symptom onset and reperfusion. Figure 4 shows the different time intervals analyzed for every AC with significant differences in all of them. Figure 5 summarizes the causes of unjustified delays between the first medical contact and reperfusion for every AC.
Table 3. Location of the first medical contact and time intervals between the first medical contact and reperfusion per autonomous community
| First EMS care | First care provided at the health center | First non-pPCI-capable center care | First pPCI-capable center care | Transfer without going to the CL right away* | Time of onset of pain to FMC | Time of FMC to ECG | Time of FMC to pPCI-capable center in transferred patients | Time from FMC to reperfusion | Time from onset of pain to reperfusion | |
|---|---|---|---|---|---|---|---|---|---|---|
| Andalusia | 206/537 (38.4) | 138/537 (25.7) | 93/537 (17.3) | 100/537 (18.6) | 188/427 (44.0) | 60 [30-123] | 5 [3-10] | 80 [50-120] | 113 [70-170] | 195 [135-330] |
| Aragon | 46/123 (37.4) | 23/123 (18.7) | 42/123 (34.1) | 12/123 (9.8) | 23/110 (20.9) | 62.5 [18.5-170] | 7 [4-12.5] | 84.5 [45-145] | 116.5 [70.5-177.5] | 229 [126-345] |
| Principality of Asturias | 32/123 (26.0) | 18/123 (14.6) | 36/123 (29.3) | 37/123 (30.1) | 4/86 (4.7) | 80 [32-210] | 10 [5-22] | 85 [60-119] | 108 [73-137] | 215 [134.5-351] |
| Balearic Islands | 33/95 (34.7) | 26/95 (27.4) | 27/95 (28.4) | 9/95 (9.5) | 3/85 (3.5) | 70 [30-164] | 6 [5-10] | 100 [55-139] | 124 [85-169] | 197.5 [143.5-391] |
| Canary Islands | 28/178 (15.7) | 103/178 (57.9) | 22/178 (12.4) | 25/178 (14.0) | 77/152 (50.7) | 75 [37.5-150] | 9 [5-15] | 85 [55-133] | 122 [95-172] | 220 [159-385] |
| Cantabria | 15/58 (25.9) | 19/58 (32.8) | 13/58 (22.4) | 11/58 (19.0) | 26/46 (56.5) | 53 [25-145] | 5 [4.5-10] | 60 [35-93] | 110 [81-188] | 210 [134-303.5] |
| Castile and Leon | 97/290 (33.5) | 70/290 (27.2) | 68/290 (23.5) | 46/290 (15.9) | 70/237 (29.5) | 90 [35-221] | 8 [4-15] | 115 [70-165] | 135 [85-197] | 242.5 [163-432.5] |
| Castile-La Mancha | 69/196 (35.2) | 61/196 (31.1) | 30/196 (17.3) | 36/196 (18.4) | 49/160 (30.6) | 68 [30-160] | 10 [5-15] | 86.5 [58-114] | 109 [80-155] | 205 [150-322] |
| Catalonia | 332/847 (39.2) | 161/847 (19.0) | 256/847 (30.2) | 98/847 (11.6) | 115/730 (15.8) | 63 [30-160] | 6 [3-14] | 75 [55-105] | 104 [80-138] | 180 [127-288] |
| Extremadura | 43/126 (34.1) | 36/126 (28.6) | 22/126 (17.5) | 25/126 (19.8) | 27/93 (29.0) | 81.5 [44-135] | 10 [5-12] | 91.5 [60-143] | 121 [90-178] | 240 [160-360] |
| Galicia | 84/264 (31.8) | 111/264 (42.1) | 28/264 (10.6) | 41/264 (15.5) | ND | 60 [26-179] | 9 [5-19] | 95 [70-140] | 115 [88.5-163] | 194 [134-353] |
| La Rioja | 10/34 (29.4) | 9/34 (26.5) | 6/34 (17.7) | 9/34 (26.5) | 3/25 (12.0) | 76.5 [35-110] | 4.5 [1-10] | 70 [46-86] | 90.5 [67-114] | 159.5 [118.5-212.5] |
| Community of Madrid | 196/429 (45.7) | 37/429 (8.6) | 80/429 (18.7) | 116/429 (27.0) | 142/309 (45.6) | 63 [35-140] | 6 [3-12] | 60 [42-85] | 95 [75-130] | 178.5 [135-257.5] |
| Region of Murcia | 102/238 (42.9) | 36/238 (15.1) | 74/238 (31.1) | 26/238 (10.9) | 25/212 (11.8) | 56.5 [24-131] | 5 [5-10] | 80 [60-120] | 103 [79-160] | 175 [130-305] |
| Chartered Community of Navarre | 22/45 (48.9) | 7/45 (15.6) | 3/45 (6.7) | 13/45 (28.9) | 12/32 (37.5) | 63.5 [29.5-124.5] | 1 [0-5] | 50 [35-91] | 90 [69-140] | 175 [128-262] |
| Basque Country | 76/199 (38.2) | 28/199 (14.1) | 37/199 (18.6) | 58/199 (29.2) | 61/138 (44.2) | 80 [32-184] | 6.5 [3-11] | 61 [49-77] | 97 [75-135] | 210 [134-345] |
| Valencian Community | 128/521 (24.6) | 146/521 (28.0) | 128/521 (24.6) | 119/521 (22.8) | 98/398 (24.6) | 82 [35-180] | 5 [0-10] | 94 [65-135] | 120 [93-165] | 220 [146-348] |
| P | < .0001 | < .0001 | < .0001 | < .0001 | < .001 | .001 | .0001 | .0001 | .0001 | .0001 |
| Total | 1519/4303 (35.3) | 1038/4303 (24.1) | 965/4303 (22.4) | 781/4303 (18.2) | 923/3240 (28.5) | 67 [30-165] | 7 [4-15] | 80 [55-120] | 110 [80-154] | 197 [135-330] |
CL, cath lab; ECG, electrocardiogram; EMS, emergency medical services; FMC, first medical contact; pPCI, primary percutaneous coronary intervention. * Patients treated early in a non-pPCI-capable center requiring immediate transfer to a pPCI-capable center. Data are expressed as no. (%) or mean [interquartile range]. Times are expressed in minutes. | ||||||||||
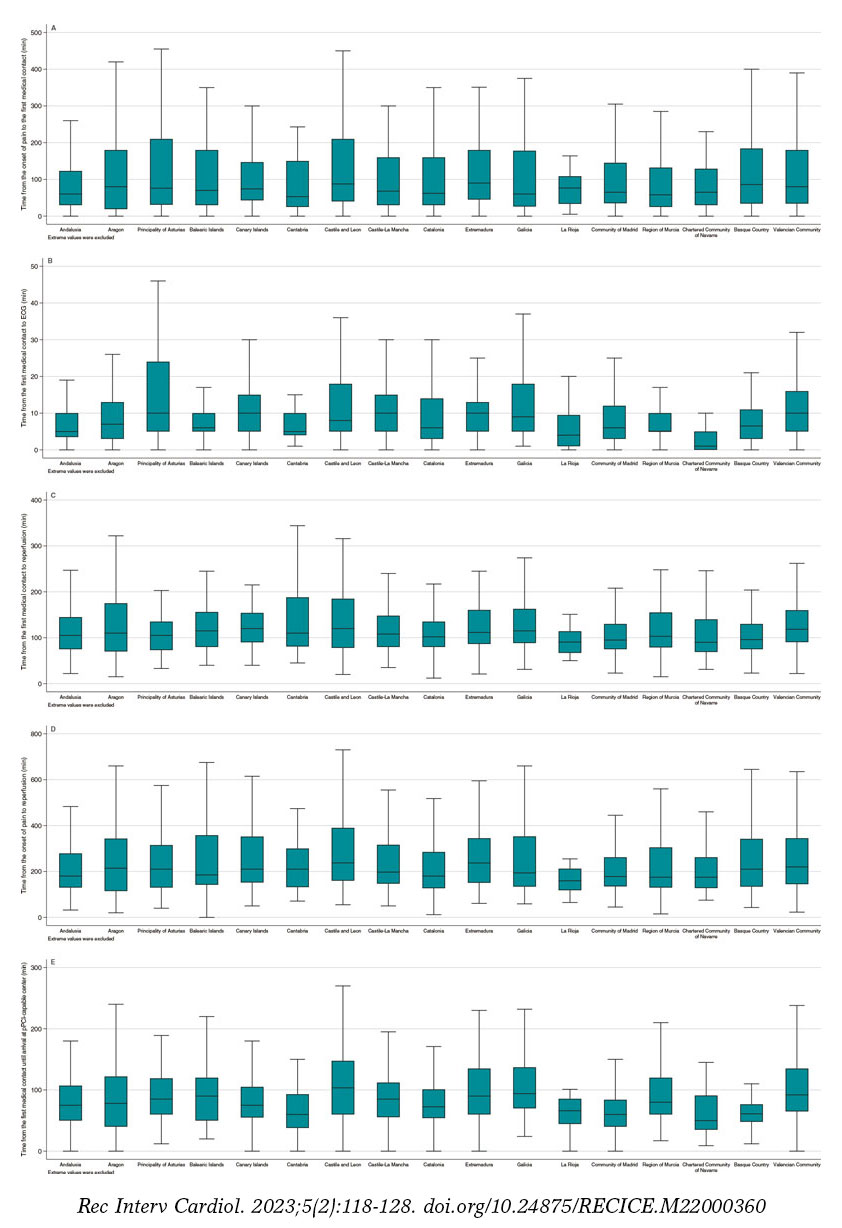
Figure 4. Time intervals between symptom onset and reperfusion in patients with ST-segment elevation myocardial infarction treated with primary percutaneous coronary intervention (pPCI) for every autonomous community. A: time in min from the onset of pain to the first medical contact. B: time in min from the first medical contact to the electrocardiogram (ECG). C: time in min from the first medical contact to reperfusion. D: time in min from the onset of pain to reperfusion. E: time in min from the first medical contact to the arrival at the pPCI-capable center in patients requiring transfer from a non-pPCI-capable center.
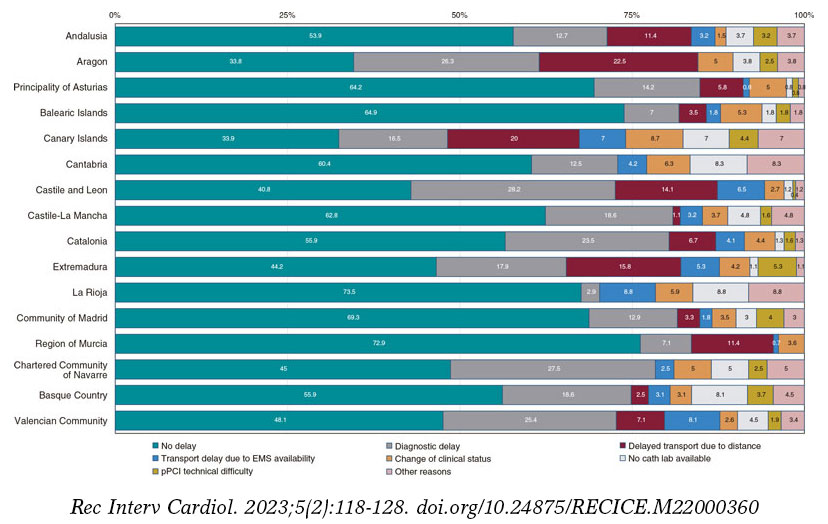
Figure 5. Causes of unjustified time delays between the first medical contact and reperfusion. Unjustified time delays did not imply, necessarily, that the time between the first medical contact and reperfusion was > 120 min. As a matter of fact, overall, in 53.2% of the cases the time between the first medical contact and reperfusion was < 120 min, and, among these, excessive time delays were reported in 21.5%. EMS, emergency medical services; pPCI, primary percutaneous coronary intervention.
Mortality analysis in patients with ST-segment elevation myocardial infarction
Table 4 includes unadjusted mortality data at hospital admission and 30 days, and mortality for the adjusted model.
Table 4. Mortality analysis in patients treated with primary percutaneous coronary intervention per autonomous community
| Unadjusted hospital mortality | Unadjusted 30-day mortality | Adjusted 30-day mortality | |
|---|---|---|---|
| Andalusia | 30/563 (5.3) | 37/523 (7.1) | 6.0 [5.3-6-7] |
| Aragon | 8/127 (6.3) | 8/124 (6.5) | 5.5 [4.0-6.9] |
| Principality of Asturias | 9/124 (7.3) | 10/118 (8.5) | 6.7 [5.4-8.0] |
| Balearic Islands | 6/97 (6.2) | 6/88 (6.8) | 5.0 [3.3-6.7] |
| Canary Islands | 15/179 (8.4) | 15/155 (9.7) | 7.0 [5.5-8.6] |
| Cantabria | 0/59 (0) | 0/59 (0) | 0 |
| Castile and Leon | 18/296 (6.1) | 23/270 (8.5) | 8.4 [7.1-9.8] |
| Castile-La Mancha | 9/197 (4.6) | 10/191 (5.2) | 3.1 [2.3-3.8] |
| Catalonia | 29/854 (3.4) | 58/801 (7.2) | 6.0 [5.4-6.6] |
| Extremadura | 12/127 (9.5) | 16/125 (12.8) | 8.1 [6.6-9.5] |
| Galicia | 22/264 (8.3) | 28/260 (10.8) | 6.8 [5.6-7.9] |
| La Rioja | 1/34 (2.9) | 1/33 (3.0) | 5.6 [2.3-8.9] |
| Community of Madrid | 14/436 (3.2) | 21/421 (5.0) | 3.9 [3.3-4.6] |
| Region of Murcia | 21/237 (8.9) | 24/226 (10.6) | 9.2 [8.0-10.5] |
| Chartered Community of Navarre | 5/45 (11.1) | 5/45 (11.1) | 9.5 [6.7-12.3] |
| Basque Country | 12/200 (6.0) | 16/197 (8.1) | 8.9 [7.4-10.4] |
| Valencian Community | 47/526 (8.9) | 55/499 (11.0) | 10.2 [9.2-11.2] |
| P | < .001 | < .001 | .19 |
| Total | 258/4365 (5.9) | 337/4166 (8.1) | – |
Data are expressed as no. (%) or mean [interquartile range]. | |||
30-day mortality rate was different across different AC (P < .001). When the analysis was adjusted for patient-dependent factors and the healthcare network, mortality difference across the AC lost its statistical significance (P = .19).
DISCUSSION
This study is a comparative of how the different STEMI care programs work in Spain. Results show differences in the incidence rate, the patients’ clinical profile, revascularization therapy, the characteristics of the interventional procedure performed, infarction care times, and the 30-day unadjusted mortality rate. Although mortality differences reduce, they’re still significantly different after adjusting for the patients’ risk and clinical characteristics. Also, they disappear after adjusting for whoever is responsible for the first medical contact, time to reperfusion, and location where critical care is administered, all of them factors associated with the way each network is organized.
Both functioning and results of infarction care networks are highly influenced by different factors like geography, the number of capable centers, transfer times, the availability of the right resources, infrastructure, and the characteristics of each healthcare system.2 In Spain, the plan of each AC has been designed independently. Also, the services rendered by the different AC is not homogeneous since resource allocation by the different administrations of the 17 Spanish AC is decentralized2 in such a way that there are inequalities in the ways these networks are organized.2,5,10,11 A recent consensus document on the requirements and sustainability of pPCI programs in Spain proposed measures to homogenize and secure their sustainability.2,12 Our study data reinforce the need for taking measures like the proposals made in the said consensus document.
Differences in the patients’ clinical profile
Registry data demonstrated a difference in the number of codes activated per million inhabitants. Also, in the number of patients with STEMI per million inhabitants across the different AC. These differences are multifactorial and can be seen, historically, in the ACI-SEC annual activity registry reports.3 Some AC have older populations and more cardiovascular risk factors, which could account for the higher rate of infarction reported.6 However, the lack of a unified criterion on the indication for Infarction Code activation could also account for these differences seen.5
Differences in reperfusion therapy
pPCI is the treatment of choice for the management of STEMI.1 The geographical (populations far from pPCI-capable centers) and organizational characteristics (availability of medical service transport with ECG monitorization) across the different AC lead to a variable number of patients be treated with fibrinolysis. A previous analysis of data on the Codi Infart in Catalonia revealed that patients treated with fibrinolysis in non- pPCI-capable centers had worse disease progression compared to those transferred to pPCI-capable centers within the first 140 min after diagnosis.13
Different time delays to reperfusion
Patient-dependent time delays (from symptom onset to first medical contact) were highly variable. Although the geographic distribution of the population could partially account for these differences, public campaigns should be run to increase awareness on STEMI symptoms and the need for calling out-of-hospital emergency care.1
System-dependent time delays (from first medical contact to reperfusion) is much easier to change with organizational measures. Also, it determines prognosis.14 Time delays to reperfusion depend on whoever is involved in the first medical contact. Therefore, patients treated by emergency medical services—those with the shortest times—showed high variability across the different programs. Better access to these systems for the population would also improve time delays to reperfusion.15
European clinical practice guidelines on the management of STEMI describe quality indicators that should be observed by the infarction networks to reduce the time to reperfusion, among these, a single coordination centralized center, interpreting the ECG before arriving at the hospital to achieve diagnosis and activate the system early, the direct transfer of patients to the cath lab without ER or ICU admissions or the follow-up of infarction care times, among other.1 Our study demonstrated that not all programs meet these recommendations meaning that, in many cases, there is a huge room for improvement. For example, currently, it does not seem reasonable that a significant number of patients who need to be transferred to the pPCI (up to 50% in some cases) wouldn’t end up at the cath lab right away. This simple measure can reduce time to reperfusion in 20 min and have a direct impact on prognosis.16,17
The presence of unjustified delayed reperfusion times was highly variable across the different AC, as well as the causes for these delays, which is indicative of the characteristics of each AC.
Mortality differences
A study conducted by Cequier et al.18 analyzed standardized mortality based on the risk of patients with STEMI across different AC from 2003 through 2012 and detected significant differences. However, across this period, not all regions had implemented Infarction Code programs and the rate of pPCI was highly variable. Our study demonstrated that there are still differences in crude mortality that disappear after adjusting for the clinical variables and care network-related variables (location of first medical contact, delay to reperfusion, and management of critically ill patients). We have already mentioned the importance that the first medical contact should be performed by emergency medical services and the measures used to reduce time to reperfusion. Regarding the management of critically ill patients, a study conducted by Sánchez-Salado et al.19 of 20 000 patients with cardiogenic shock demonstrated that the availability of cardiac surgery intensive care units was associated with a lower mortality rate. Data from this study added to the finding of our registry support the need for expanding the availability of cardiac surgery intensive care units in large volume centers of patients with acute coronary syndrome. In conclusion, the results of mortality study suggest that the organization of the different networks would increase the crude mortality rate seen in some AC.
Limitations
This study has some limitations. In the first place, it is based on self-reported data without external auditing. However, data on interventional cardiology are rather standardized across the world, and the electronic form for data curation was designed to be applied both intuitively and universally. Also, data from Catalonia and Galicia were collected from their official registries, reviewed, and then audited.
Secondly, the profile of patients may have been different across the different AC. To address this limitation and its possible impact on the different crude mortality rates reported, a mortality study was conducted across different AC after adjusting for different clinical variables and care networks. Therefore, some models may be over-adjusted, which is why formal statistical comparisons across AC should be interpreted as cautious as the associations described in any observational trial. The model did not include patients lacking some of the variables included in the model. Table 1 of the supplementary data shows patients discarded from the study for every AC.
Thirdly, patients with STEMI treated outside the infarction networks were not included in this study, although this is probably indicative of a mild selection bias due to its reduced number. Therefore, the greater bias occurs in patients without reperfusion therapy, who, at times, are not covered by these networks. For this reason, these patients were not considered in the mortality analysis. Similarly, patients with myocardial infarction and subacute presentation without emergency reperfusion criteria were not included in the study.
Fourthly, the way of collecting times may have presented some differences between centers and AC. However, since this was a prospective study with previously established definitions, we believe that these differences may have been minimized.
In the fifth place, the data presented date back to 2019. Since then, no big organizational changes have occurred to justify changes in the dynamics of functioning or relevant changes have been made in the European guidelines on the management of STEMI (published back in 2017). Also, in a study conducted during the first wave of the COVID-19 pandemic no differences were seen regarding the type of reperfusion therapy used or time between the first medical contact and reperfusion. However, an increased mortality rate was seen attributed, among other causes, to longer ischemia times.20
Finally, this study only included patients for a period of 3 months. However, we think these data can be generalized to what happens in a much larger period.
CONCLUSIONS
This registry showed significant differences in STEMI care across the different Spanish AC regarding incidence rate, the patients’ clinical characteristics, reperfusion therapy, time delays to reperfusion, and 30-day crude mortality rate. After adjusting for the clinical characteristics and variables associated with the care network, no differences mortality differences were reported across the different AC.
Standardizing the organization and functioning of Infarction Code networks could correct some of the differences seen in the management of STEMI.
FUNDING
None whatsoever.
AUTHORS’ CONTRIBUTIONS
Drafting of the manuscript: O. Rodríguez-Leor, A.B. Cid-Álvarez, A. Pérez de Prado, and X Rosselló. Process of manuscript revision: all the authors. Statistical analysis: O. Rodríguez-Leor, and X. Rosselló. Database review: O. Rodríguez-Leor, A.B. Cid-Álvarez, and A. Pérez de Prado. Data coordination across the different regional network: all the authors.
CONFLICTS OF INTEREST
A. Pérez de Prado received numerous personal fees from iVascular, Boston Scientific, Terumo, Bbraun, and Abbott Vascular. Á. Cequier received personal fees from Ferrer International, Terumo, Astra Zeneca, and Biotronik. R. Moreno, S. Ojeda, R. Romaguera, and A. Pérez de Prado are associate editors of REC: Interventional Cardiology. The journal’s editorial procedure to ensure impartial handling of the manuscript has been followed. The remaining authors did not declare any conflicts of interest associated with the content of this manuscript.
ACKNOWLEDGEMENTS
The authors wish to thank all health professionals involved in STEMI care programs for their not always rewarded work, effort, and dedication. Also, they wish to thank Meia Faixedas, and Josepa Mauri from the Departament de Salut de la Generalitat de Catalunya for granting us access to data from the Catalonian Registre de Codi Infart, and the entire personnel from Servicio Gallego de Salud (SERGAS) involved in the coordination of the REGALIAM registry for facilitating access to its data.
SUPPLEMENTARY DATA

REFERENCES
1. Ibañez B, James S, Agewall S, et al. 2017 ESC Guidelines for the management of acute myocardial infarction in patients presenting with ST-segment elevation: The Task Force for the management of acute myocardial infarction in patients presenting with ST-segment elevation of the European Society of Cardiology. Eur Heart J. 2018;39:39:119-177.
2. Cequier A, Pérez de Prado A, Cid-Álvarez AB, et al. Requisitos y sostenibilidad de los programas de ICP primaria en España en el IAMCEST. Documento de consenso de SEC, AEEC y SEMES. REC Interv Cardiol. 2019;1:108-119.
3. Ojeda S, Romaguera R, Cruz-González I, Moreno R. Registro español de hemodinámica y cardiología intervencionista. XXIX Informe Oficial de la Asociación de Cardiología Intervencionista de la Sociedad Española de Cardiología (1990-2019). Rev Esp Cardiol. 2020;73:927-936.
4. Rodríguez-Leor O, Cid-Álvarez AB, Pérez de Prado A, et al. Análisis de la atención al infarto con elevación del segmento ST en España. Resultados del Registro de Código Infarto de la ACI-SEC. Rev Esp Cardiol. 2022;75:669-680.
5. Rodríguez-Leor O, Cid-Álvarez AB, Moreno R, et al. Encuesta sobre las necesidades de los programas de angioplastia primaria en España. REC Interv Cardiol. 2020;1:8-14.
6. Instituto Nacional de Estadística. Datos de población de comunidades autónomas. Available online: https://www.ine.es/jaxiT3/Datos.htm?t=2915#!tabs-tabla. Accessed 24 Jan 2022.
7. Bueno H, Rosselló X, Pocock SJ, et al. In-hospital coronary revascularization rates and post-discharge mortality risk in non-ST-segment elevation acute coronary syndrome. J Am Coll Cardiol. 2019;74:1454-1461.
8. Rosselló X, Huo Y, Pocock S, et al. Global geographical variations in ST-segment elevation myocardial infarction management and post-discharge mortality. Int J Cardiol. 2017;245:27-34.
9. Bueno H, Rosselló X, Pocock S, et al. Regional variations in hospital management and post-discharge mortality in patients with non-ST-segment elevation acute coronary syndrome. Clin Res Cardiol. 2018;107:836-844.
10. Alter DA, Austin PC, Tu JV, et al. Canadian cardiovascular outcomes research. Community factors, hospital characteristics and inter-regional outcome variations following acute myocardial infarction in Canada. Can J Cardiol. 2005;21:247-255.
11. Bertomeu V, Cequier A, Bernal JL, et al. In-hospital mortality due to acute myocardial infarction. Relevance of type of hospital and care provided. RECALCAR study. Rev Esp Cardiol. 2013:66:935-942.
12. Moreno R, Ojeda S, Romaguera R, et al. Actualización de las recomendaciones sobre requisitos y equipamiento en cardiología intervencionista. Documento de consenso de la Asociación de Cardiología Intervencionista y la Asociación de Cardiopatía Isquémica y Cuidados Agudos Cardiovasculares de la Sociedad Española de Cardiología y la Asociación Española de Enfermería en Cardiología. REC Interv Cardiol. 2021;3:33-44.
13. Carrillo X, Fernandez-Nofrerias E, Rodriguez-Leor O, et al. Early ST elevation myocardial infarction in on-capable percutaneous coronary intervention centres: in situ fibrinolysis vs. percutaneous coronary intervention transfer. Eur Heart J. 2016;37:1034-1040.
14. Terkelsen CJ, Sorensen JT, Maeng M, et al. System delay and mortality among patients with STEMI treated with primary percutaneous coronary intervention. JAMA. 2010;304:763-771.
15. Rodríguez-Leor O, Fernández-Nofrerías E, Mauri F, et al. Analysis of reperfusion delay in patients with acute myocardial infarction treated with primary angioplasty based on first medical contact and time of presentation. Rev Esp Cardiol. 2011;64:476-483.
16. Rodríguez-Leor O, Fernández-Nofrerías E, Mauri J, et al. Integration of a local into regional primary angioplasty action plan (the Catalan Codi Infart network) reduces time to reperfusion. Int J Cardiol. 2013;168:4354-4357.
17. Bagai A, Jollis JG, Dauerman HL, et al. Emergency department bypass for ST-segment-elevation myocardial infarction patients identified with a prehospital electrocardiogram: a report from the American Heart Association Mission: Lifeline program. Circulation. 2013;128:352-359.
18. Cequier A, Ariza-Sole A, Elola FJ, et al. Impacto en la mortalidad de diferentes sistemas de asistencia en red para el tratamiento del infarto agudo de miocardio con elevación del segmento ST. La experiencia de España. Rev Esp Cardiol. 2017;70:155-161.
19. Sánchez-Salado JC, Burgos V, Ariza-Solé A, et al. Trends in cardiogenic shock management and prognostic impact of type of treating center. Rev Esp Cardiol. 2020;73:546-553.
20. Rodríguez-Leor O, Cid-Álvarez AB, Pérez de Prado A, et al. Impact of COVID-19 on ST-segment elevation myocardial infarction care. The Spanish experience. Rev Esp Cardiol. 2020;73:994-1002.
* Corresponding author.
E-mail address: oriolrodriguez@gmail.com (O. Rodríguez-Leor).


